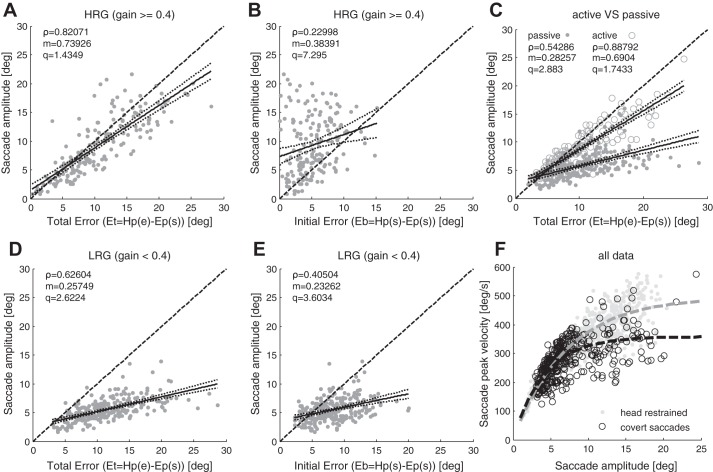
Fig. 4.
A–E: sample correlation coefficient ρ; dark solid lines represent the linear fit y = mx+q with dotted lines representing the bounds of the coefficient’s confidence interval; dark dashed line represents the bisector. Significance level of the parameters *P < 0.05, **P < 0.01, ***P < 0.001). A: saccade amplitude against Et for HRG (ρ***, m***, q**). B: saccade amplitude against Eb for HRG (ρ**, m**, q***). C: saccade amplitude against Et for passive (gray dots, ρ***, m***, q***) and active head rotations (gray circles, ρ***, m***, q***). If the head movement is active, saccades are more accurate. D: saccade amplitude against Et for LRG (ρ***, m***, q***). E) Saccade amplitude against Eb for LRG [(ρ***, m***, q***). Saccades are triggered to compensate Et; high residual VOR gain improves the precision of saccades. Main sequence exponential fit y = A*[1−e(−x/C)]. In head restrained condition A = 496, C = 7, gray dashed line; for covert saccades during head impulses A = 358, C = 4, black dashed line.

