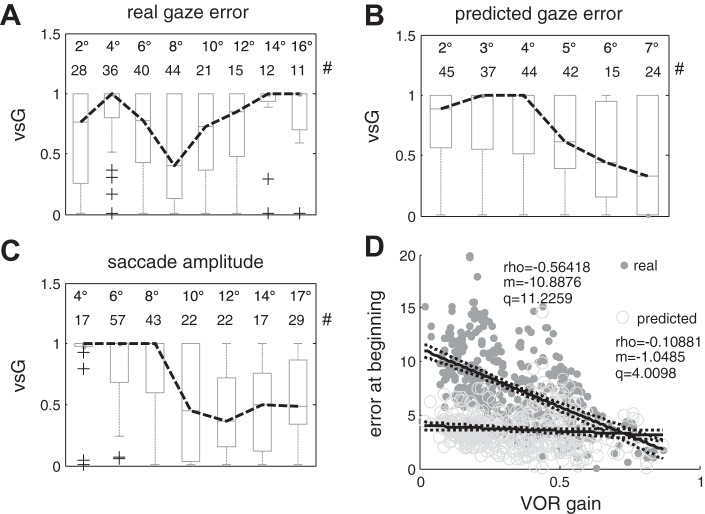
Fig. 8.
A–C: relationships between the vsG parameter, i.e., the parameter regulating the contribution of the VOR to the eye movement response during covert saccades, to the real gaze error, to the internal estimate of gaze error and to the recorded saccade amplitude. For vsG = 1 the VOR is added to the saccade command, for vsG = 0 the VOR contribution is entirely suppressed. For all plots the top two rows show the amplitude and the number of saccades for each bin, respectively. In each box, the central mark is the median, the edges are the 25th and 75th percentiles, the whiskers extend to the most extreme data points not considered outliers, and outliers are plotted individually as crosses. The black dashed line connects the median of each bin. A: vsG against gaze error measured at the beginning of the saccade and binned in groups 1–3, 3–5, 5–7, 7–9, 9–11, 11–13, 13–15, 15–17°; B: vsG against predicted gaze error estimated at the beginning of the saccade and binned in groups 0–2, 2–3,3–4,4–5,5–6,6–8°; C: vsG against saccade amplitudes binned in groups 2–5, 5–7, 7–9, 9–11, 11–13, 13–15, 15–19°. D: real gaze error [dark gray dots, (ρ***, m***, q***)] and predicted gaze error (gray circles, ρ*, m*, q***) at the beginning of saccades against residual VOR gain.

