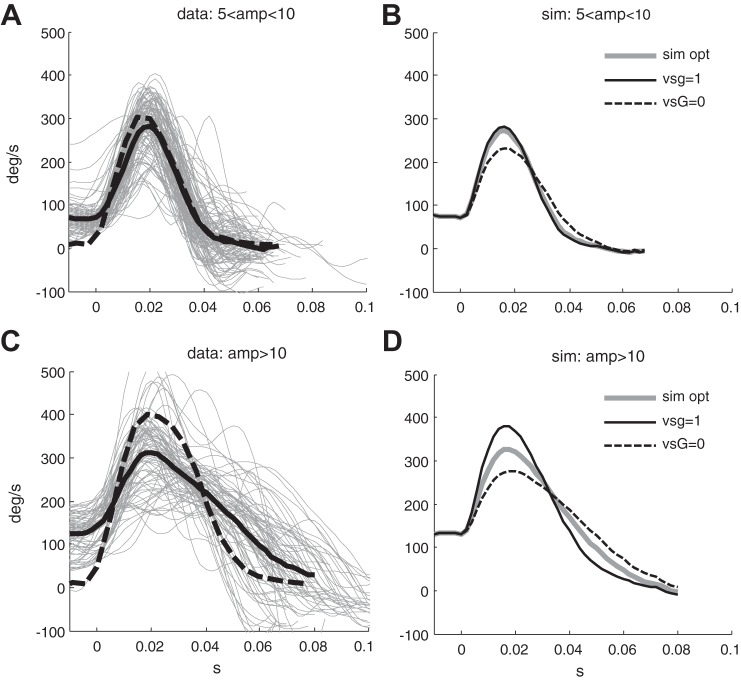
Fig. 9.
A and C: eye velocity of individual covert saccades between 5 and 10° (A) and greater than 10° (C) (gray lines) and their means (black bold line), respectively. Black dashed lines represent the mean velocity of saccades of the same range of amplitudes made in the head-restrained condition. B and D: Mean of all simulations of covert saccades having an initial eye velocity greater than 50°/s, between 5 and 10° and greater than 10° amplitude, respectively. Gray lines represent the simulation with pG and vsG estimated through optimization, while solid black lines represent the simulation forcing vsG = 1 (linear summation hypothesis) and dashed black line forcing vsG = 0 (VOR command disengaged during the saccade).

