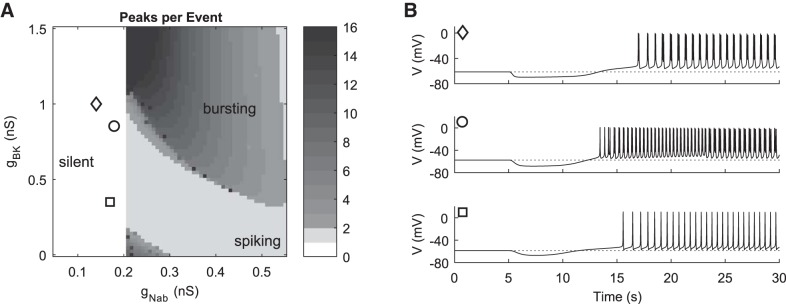
Fig. 8.
Simulation of AVP responses in a model including ER Ca2+ dynamics. A: peaks per event as a function of variation in the 2 parameters gBK and gNab. Three representative parameter combinations are indicated by markers for which AVP stimulation reproduces the experimental time courses. ER Ca2+ dynamics are included, and the calcium leak and inward rectifier conductances were increased to gCa,leak = 0.05 nS and gKir = 1.5 nS, respectively. Parameter combinations (gNab, gBK): ◇, (0.14, 1); ○, (0.18, 0.85); □, (0.17, 0.35). All other parameter values had default values. B: time courses for AVP responses of the model at the 3 parameter combinations indicated by corresponding markers in A. AVP application is simulated beginning at time = 5 s by increasing the ER leak rate from default value prel = 0.0001 s−1 transiently following a fast pulse profile (τ = 1 s, kp = 10), and by simultaneously activating an inward ohmic conductance gAVP following a slower pulse profile (τ = 12.5 s, parameter kp = 1). To model the different doses of AVP in Fig. 2C, maximum increase in prel during the pulse was 0.01 s−1, 0.0025 s−1, and 0.001 s−1, and peak gAVP was 0.07 nS (top), 0.055 nS (middle), and 0.04 nS (bottom).

