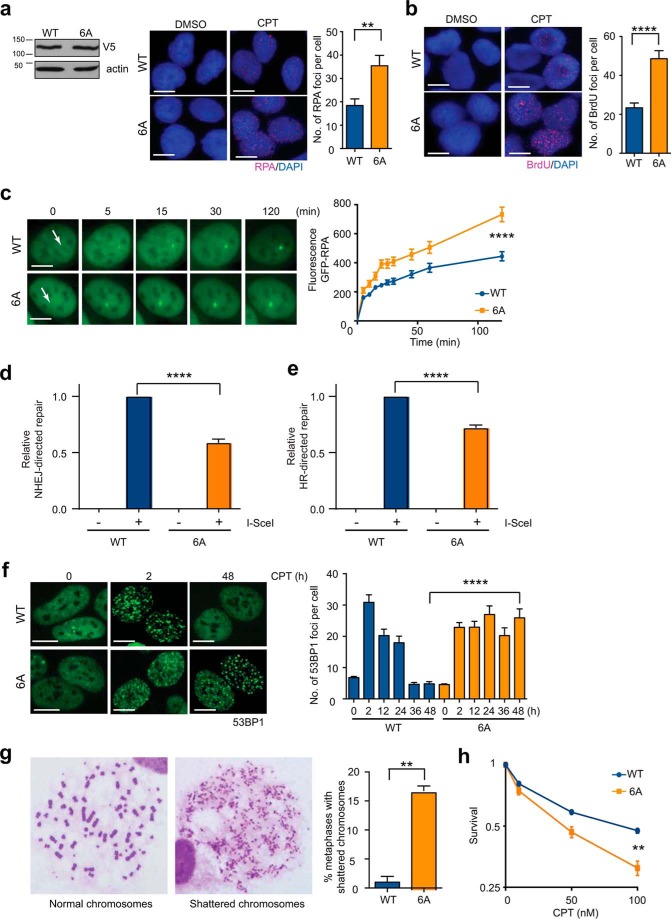
Figure 4.
EXO1 degradation prevented hyper-resection and genomic instability. a, U2OS cells were depleted of endogenous EXO1 using siRNA and complemented with V5-tagged, siRNA-resistant wild-type (WT), or phosphorylation site mutant (6A)-EXO1. Cells were treated with CPT or DMSO as control for 4 h and immunostained with anti-RPA antibody (red). Nuclei were stained with DAPI (blue). Representative images are shown. The plot shows average numbers of RPA foci per cell after subtracting background (average numbers of foci in DMSO-treated cells). V5-EXO1 expression was verified by Western blotting with anti-V5 antibody. b, U2OS cells expressing WT- or 6A-EXO1 were treated with CPT or DMSO for 4 h and immunostained for BrdU/ssDNA foci (red). Representative images are shown. The plot shows average numbers of BrdU foci per cell after subtracting background. c, U2OS cells expressing WT- or 6A-EXO1 along with GFP-RPA were laser-micro-irradiated to induce focal DSBs. Time-lapse images of accumulation of GFP-RPA at DSBs (arrows) are shown. The plot shows recruitment of GFP-RPA after DNA damage. d, NHEJ efficiency was measured by quantifying RFP expression (by flow cytometry) in HEK293 cells harboring a GFP/RFP reporter after transfection with an I-SceI plasmid. Cells were depleted of endogenous EXO1 using siRNA and complemented with WT- or 6A-EXO1. The plot shows NHEJ-directed repair relative to WT-EXO1-expressing cells. e, HR efficiency was measured by quantifying GFP expression in HEK-293 cells harboring a DR-GFP reporter after transfection with an I-SceI plasmid. Cells were depleted of endogenous EXO1 using siRNA and complemented with WT- or 6A-EXO1. The plot shows HR-directed repair relative to WT-EXO1 expressing cells. f, U2OS cells depleted of endogenous EXO1 and complemented with WT- or 6A-EXO1 were treated with CPT and immunostained for 53BP1 foci (green) at the indicated times post treatment. Representative images are shown. Rates of DSB repair were determined by scoring 53BP1 foci and plotting average number of 53BP1 foci per cell (y axis) versus time (x axis). g, percentages of metaphase spreads with shattered chromosomes are plotted for CPT-treated U2OS cells with knockdown of endogenous EXO1 and ectopic expression of WT- or 6A-EXO1. Representative metaphases are shown. Scale bar, 5 μm. h, the plot shows clonogenic survival of U2OS cells expressing WT- or 6A-EXO1. Cells were treated with the indicated doses of CPT for 4 h before plating for colony formation. All experiments were replicated three times. Error bars depict S.E. **, p < 0.005; ****, p < 0.0001.

