Figure 2.
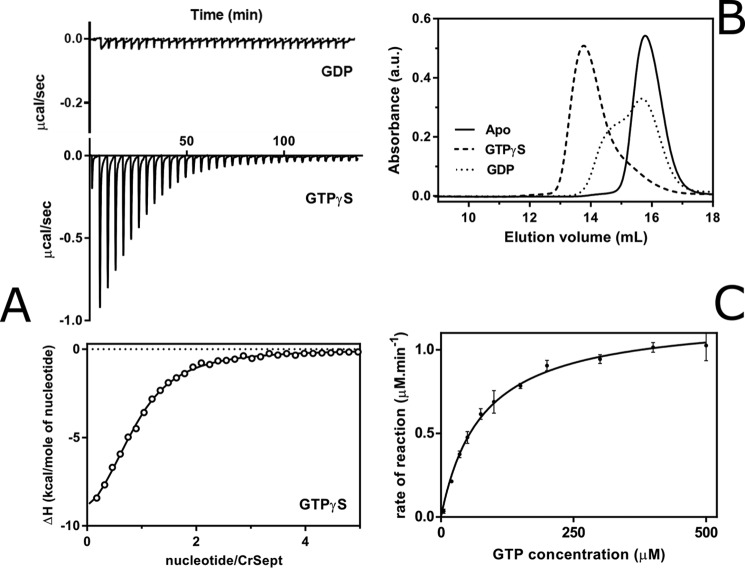
Biochemical characterization of CrSEPT. A, GTPγS binding affinity for CrSEPT was determined using ITC. Top, raw data (for GDP and GTPγS); bottom, best fit to the data for GTPγS. The binding isotherm has been fitted to a single-site binding model, yielding a Kd of 5.4 ± 0.3 μm (n = 0.84). GDP binding was not detectable (data not shown). B, influence of the nucleotide on the oligomeric state of CrSEPT. Aliquots of CrSEPT (10 μm), either nucleotide-free (solid line, monomer), complexed to GTPγS (dashed line, dimer), or complexed to GDP (dotted line) were analyzed by SEC on a Superdex 200 10/300 GL column and monitored at 280 nm. C, GTP hydrolysis by CrSEPT was assayed by measuring Pi release as a function of time. Initial rates were obtained from the slopes of phosphate-accumulation curves and fitted to a Michaelis-Menten model. Experiments were performed in triplicate, and the mean and S.D. values are reported. We obtained a kcat value of 2.41 ± 0.02 min−1. GraphPad Prism version 6.0 was used for all data fitting.

