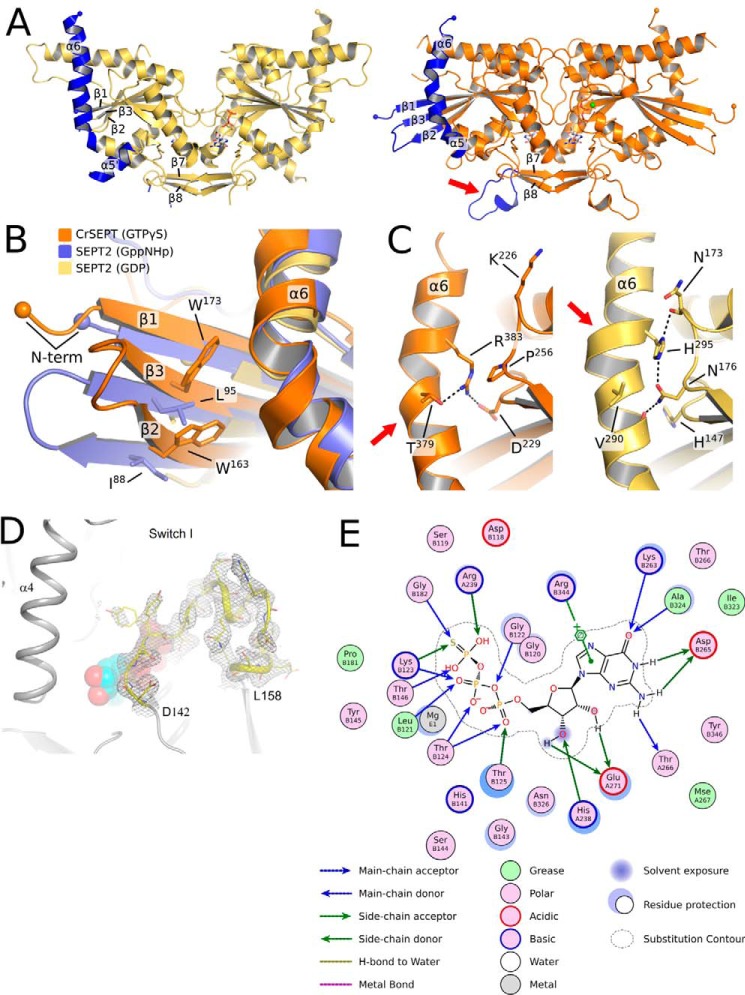
Figure 3.
Comparison between the structures of SEPT2 and CrSEPT. A, schematic representation of SEPT2 (left, PDB entry 2QNR) and CrSEPT (right). In both structures, β1, β2, β3, α5′, α6, and the loop before the β hairpin (β7 and β8) are highlighted (in blue). The latter is indicated with an arrow. These are the most notable structural differences when compared with SEPT2, particularly the protrusion of the three β-strands. B, superimposition of CrSEPT, SEPT2 bound to Gpp(NH)p (PDB entry 3FTQ), and SEPT2 bound to GDP (PDB entry 2QNR). Side chains of CrSEPT Trp-163 and Trp-173 and SEPT2 Ile-88 and Leu-95 are shown. C, side-by-side close view of α6 region from CrSEPT (left) and GDP-bound SEPT2 (right). Black dashed lines highlight the interactions between the conserved His-195 and Arg-383 and neighbor residues, SEPT2 and CrSEPT, respectively. D, continuous electron density (gray mesh) is observed in the composite omit map for the switch I region. Residues at the beginning and end of the region are labeled explicitly, and the GTPγS is shown as solid spheres. E, schematic representation of the GTP-binding site generated with Coot using a method described by Clark and Labute (61). All residues within 4.5 Å of the ligand are represented, and the size of the halo around the residues represents the extent to which the solvent-accessible surface area was affected by ligand binding. Blue and green arrows indicate hydrogen bonds from main-chain and side-chain atoms, respectively. A π-anion interaction involving Arg-344 is explicitly represented.

