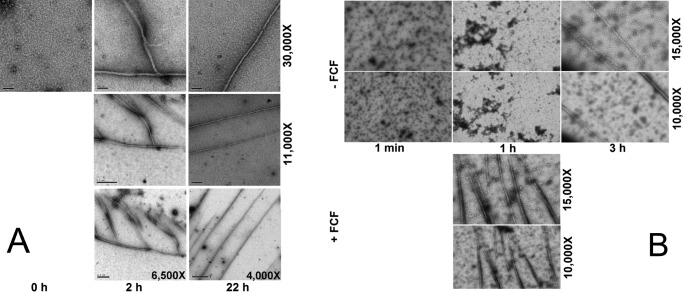
Figure 5.
CrSEPT assembles into filaments in vitro. Shown are transmission electron micrographs of negatively stained septins at low salt concentration. A, samples produced by dialysis were taken after three different time intervals: 0, 2, and 22 h; B, sample produced by dilution. Top, samples were taken at three different times: within the first minute and after 1 and 3 h, respectively, in the presence of DMSO (control). Bottom, samples were taken only after the first hour, in the presence of 70 μm FCF. Nominal magnification for each panel is shown on the right.

