Figure 3.
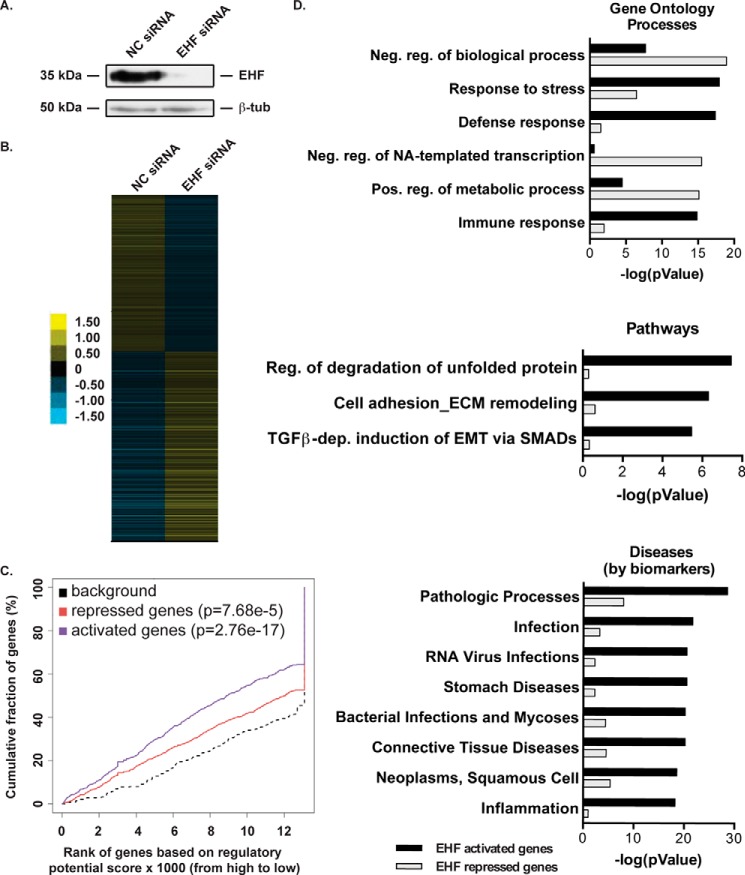
EHF depletion followed by RNA-seq identifies targets involved in the immune response and gene regulation. A, siRNA depletion of EHF in undifferentiated HBE cells was measured by Western blot with β-tubulin (β-tub) as a loading control. B, relative expression of 1145 genes that show a significant change in expression following EHF depletion in undifferentiated HBE cells (FDR < 0.05). Each row signifies a different gene. The scale is log2 -fold change relative to average gene expression. C, activating and repressive function prediction of EHF in undifferentiated primary HBE cells as determined by BETA software. The red, purple, and dashed lines indicate the down-regulated, up-regulated, and non-differentially expressed genes, respectively. The p values of activated and repressed genes compared with non-regulated genes were determined by a Kolmogorov-Smirnov test. D, MetaCore enrichment analysis of direct targets of EHF. Analysis was performed on EHF-activated (black) and -repressed (gray) genes and divided into gene ontology processes (top panel), pathways (center panel), and diseases (bottom panel). Shown are the negative logs of the p values, derived using MetaCore. Neg., negative; NA, nucleic acid; pos., positive; dep., dependent.

