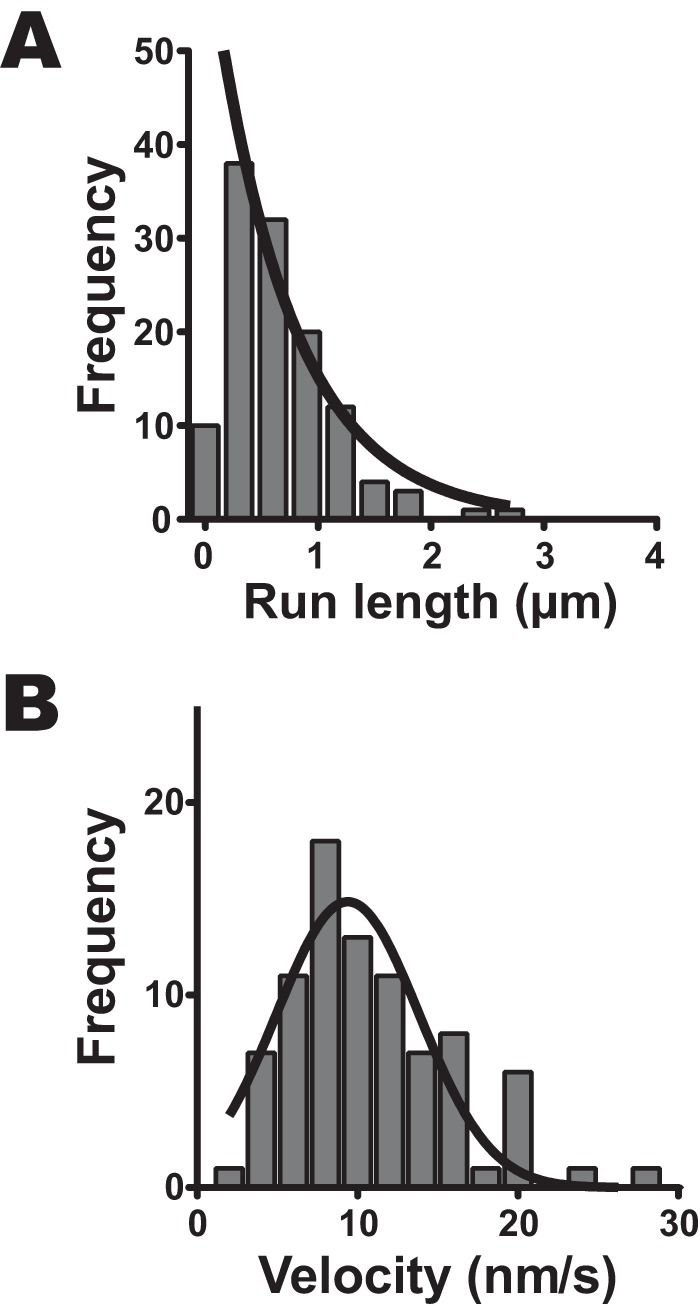
Figure 3.

Run length and velocity of human myosin VIIa dimer on single actin filaments. A, run length of HM7AΔtail/LZ. The fluorescence images were captured at 2.0 fps. The solid line shows the best fit to a single exponential equation, R0e−r/λ, where R0 is the initial frequency extrapolated to zero run length, r is run length, and λ is average run length (the first bin is excluded from the fitting). The average run length was 0.71 ± 0.09 μm (mean ± S.E., n = 121). B, the velocity of HM7AΔTail/LZ. The average velocity of the histogram was 11.0 ± 0.6 nm·s−1 (S.E., n = 86). The best fit to Gaussian equation gives the mean velocity of 9.4 ± 0.5 nm·s−1 (S.E.).
