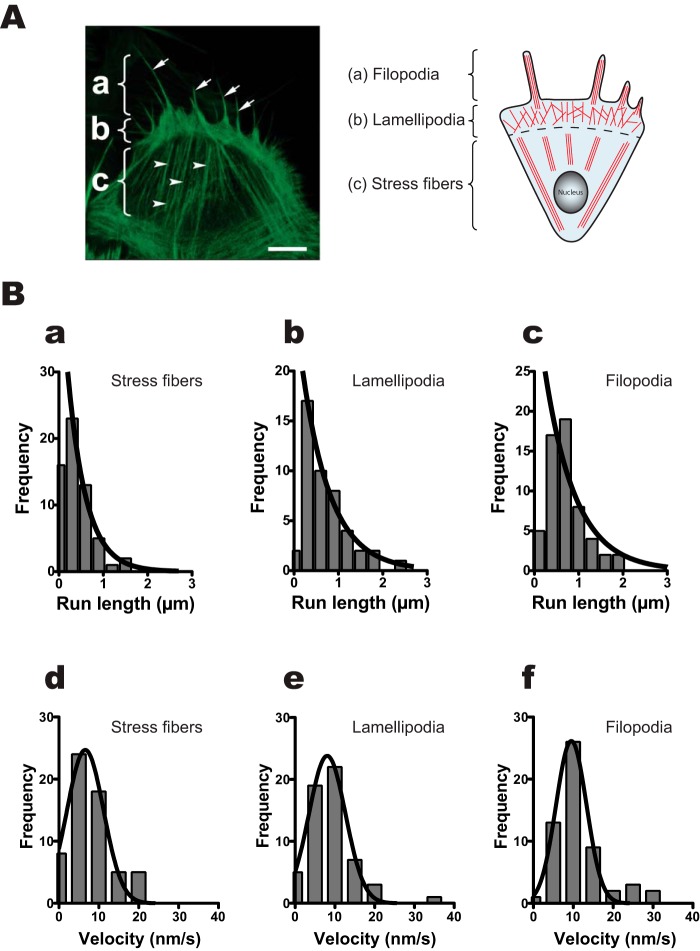
Figure 4.
Movement of human myosin VIIa dimer on MEF-3T3 cells. A, left, typical actin structural image of MEF-3T3 cell. The MEF-3T3 cells were demembranated, fixed, and stained by Alexa Fluor 568-phalloidin as described under “Experimental Procedures.” a, filopodia; b, lamellipodia; c, stress fibers. Arrows and arrowheads indicate filopodia and stress fibers, respectively. The scale bar shows 10 μm. A, right, schematic diagram of actin structures in moving cells. a, filopodia; b, lamellipodia; c, stress fibers. B, run lengths and velocities of HM7AΔtail/LZ on stress fibers (a and d), lamellipodia (b and e), and filopodia (c and f). The fluorescence images were captured at 4 fps, and run lengths and the velocities were determined from the same traces. Solid lines in a–c are the best fit to an equation, R0e−r/λ. The average run lengths (λ) are 0.41 ± 0.03 μm (mean ± S.E., n = 60), 0.59 ± 0.06 μm (S.E., n = 57), and 0.69 ± 0.13 μm (S.E., n = 56) on stress fibers (a), lamellipodia (b), and filopodia (c), respectively. The bottom three panels show the velocities of HM7AΔTail/LZ on stress fibers (d), lamellipodia (e), and filopodia (f). The best fit to Gaussian equation gave the mean velocity of 6.6 ± 0.6 nm·s−1 (mean ± S.E., n = 60), 8.1 ± 0.2 nm·s−1 (S.E., n = 57), and 9.5 ± 0.4 nm·s−1 (S.E., n = 56) for stress fibers, lamellipodia, and filopodia, respectively.

