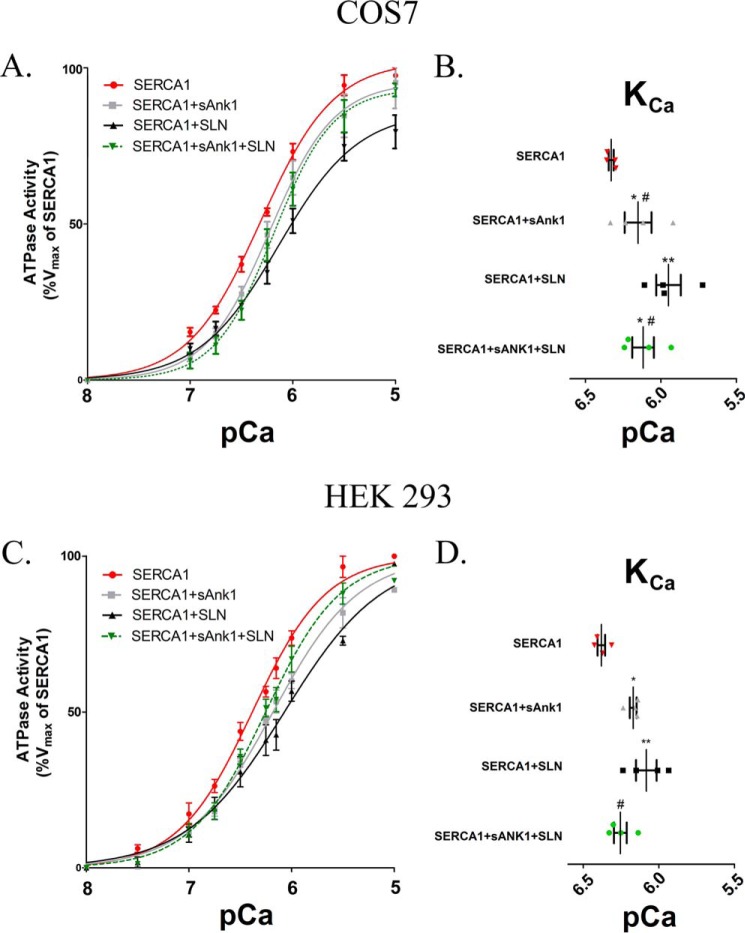
Figure 8.
Ca2+-ATPase assays. COS7 (A) and HEK293 (C) cells were transfected with the indicated cDNA construct(s) using a [C]final of 1 μg/ml. ATPase activity was determined at each [Ca2+]free compared with the Vmax measured for SERCA1 alone, following normalization of the levels of SERCA1 expression as determined by immunoblotting (see “Experimental procedures”). Data were fitted to the equation for a general cooperative model for substrate binding. Results from both cell lines show that coexpression of sAnk1 with SERCA1 leads to a reduction of SERCA1's apparent affinity for Ca2+, but the effect of sAnk1 is less than that of SLN, as shown previously (1). B and D, KCa ([Ca2+]free required for half-maximal activation) values were determined from each curve and are summarized in Tables 1 and 2. COS7 mean KCa: SERCA1 pCa = 6.33 (468 nm); SERCA1 + sAnk1 pCa = 6.15 (708 nm); SERCA1 + SLN pCa = 5.95 (1122 nm); and SERCA1 + sAnk1 + SLN pCa = 6.12 (759 nm). HEK293 mean KCa: SERCA1 pCa = 6.38 (415 nm); SERCA1 + sAnk1 pCa = 6.17 (680 nm); SERCA1 + SLN pCa = 6.08 (830 nm); and SERCA1 + sAnk1 + SLN pCa = 6.26 (560 nm). Statistics used one-way ANOVA: *, p < .05 versus SERCA1; **, p < .01 versus SERCA1; and #, p < .05 versus SERCA1 + SLN. † indicates data presented previously (1) and performed at same time as SERCA1 + sAnk1 + SLN.

