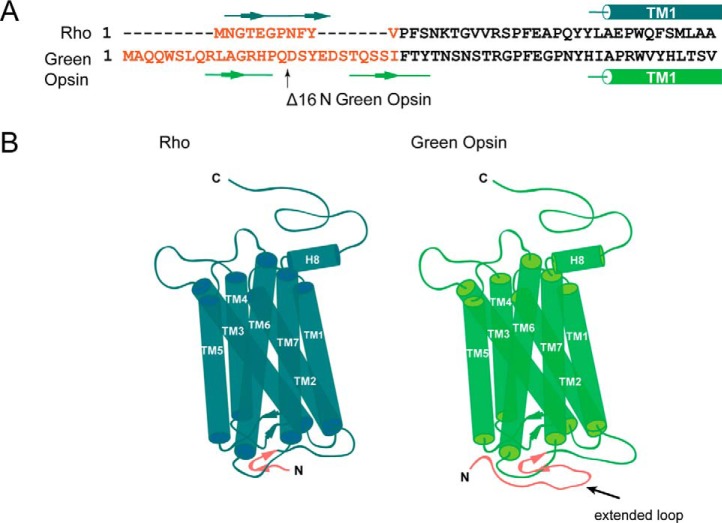
Figure 7.
Comparison of Rho sequence and structure with a green cone opsin homology model. A, sequence alignment of rod and green cone opsins were prepared in Clustal Omega; only N termini and beginning of TM1 in both Rho and green cone opsin are shown. The major difference between the N termini is shown in red. B, schematic structural model of Rho (created based on the Rho structure, PDB code 1U19) is shown on the left, and the schematic 3D homology model of green cone opsin (PDB code 1KPW) is on the right. The extended loop difference between the two N termini is shown in red.

