Figure 3.
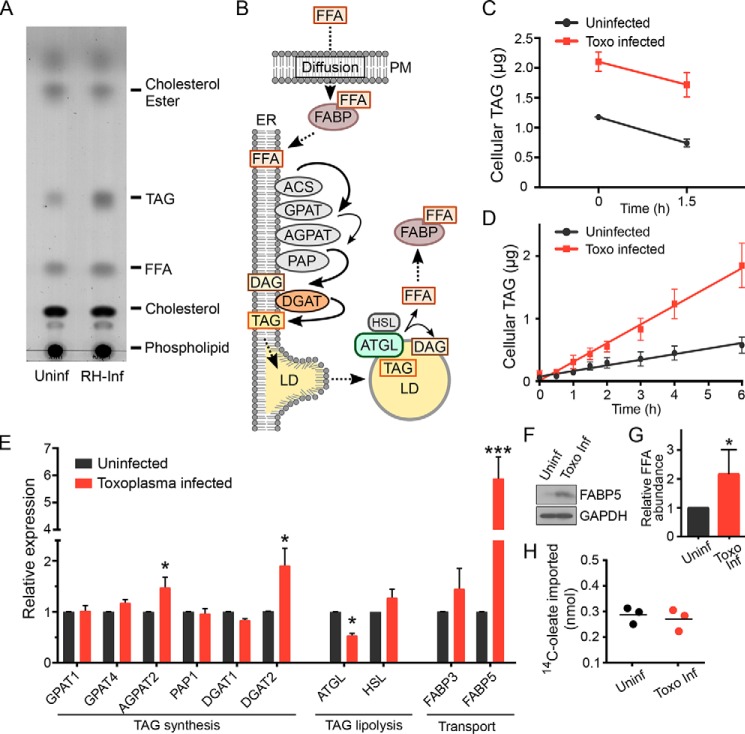
Toxoplasma infection alters host TAG synthesis. A, TLC of neutral lipids extracted from uninfected (Uninf) HFFs compared with those infected with the Toxoplasma RH strain (RH-Inf). Cells had not been treated with OA. B, diagram of cellular TAG metabolism that leads to LD formation. Enzymes and transporters are indicated as ovals and lipids as squares. Host proteins whose transcripts are altered upon parasite infection are colored. Rate-limiting reactions are indicated by thinner lines. Note that HSL and ATGL catalyze the same reaction (TAG hydrolysis). PM, plasma membrane; ACS, acyl-CoA synthetase; GPAT, glycerol-3-phosphate acyltransferase; AGPAT, 1-acylglycerol-3-phosphate acyltransferase; PAP, phosphatidate phosphatase; DAG, diacylglycerol; HSL, hormone-sensitive lipase. C, quantification of lipolysis rate. Cellular TAG was quantified after OA washout and combined with triacsin C to inhibit TAG synthesis. Cells were harvested at the indicated times, and neutral lipids were extracted and quantified as described under “Experimental procedures” (n = 3). D, quantification of TAG accumulation. HFFs were infected for 16 h or left uninfected and pulsed with 360 μm OA for the indicated times, after which total TAG levels were quantified (n = 3). Data were fit linearly using GraphPad Prism: kuninf = 0.090 ± 0.007 μg/h; kinf = 0.30 ± 0.01 μg/h. Toxo, Toxoplasma. E, host transcript levels encoding proteins associated with neutral lipid metabolism were quantified by qPCR after 24-h infection with Toxoplasma RH without OA treatment and compared with uninfected cells. One-way ANOVA: *, p < 0.05; ***, p < 0.0001. F, Western blot of cellular lysates of uninfected and Toxoplasma-infected cells probed with anti-FABP5 and GAPDH as a loading control. G, relative FFA abundance was quantified by densitometric analysis of TLC. H, uptake of [14C]oleate by uninfected and infected cells was compared after 1-h incubation.

