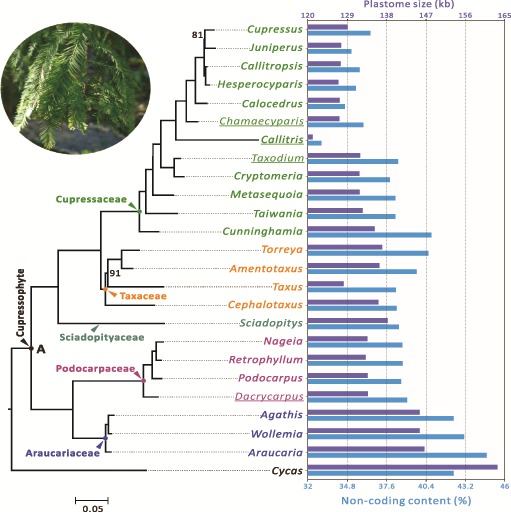
Fig. 1.—

Variation in plastome size and noncoding content (%) among the sampled 24 cupressophyte genera. A maximum likelihood (ML) tree inferred from 80 plastid protein-coding genes is shown at the left with Cycas as the outgroup. Bootstrapping supports are shown when they are < 100%. For each genus, its plastome size and noncoding content are indicated by the colored bars in the right panel, with scales labeled on the top and bottom, respectively. Taxa sequenced in this study are underlined. Node A denotes the putative common ancestor of cupressophytes. Noncoding content (%) indicates the proportion of intergenic and intronic sequences.
