Fig. 2.—

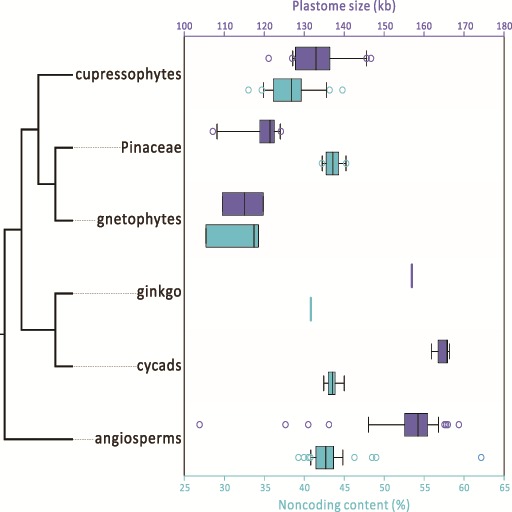
Boxplots for comparing plastome size (dark-blue) and noncoding content (light-blue) in the six seed plant groups. The tree topology (left) is based on the study of Wu, Wang, et al. (2011). Lines inside boxes are medians.

Boxplots for comparing plastome size (dark-blue) and noncoding content (light-blue) in the six seed plant groups. The tree topology (left) is based on the study of Wu, Wang, et al. (2011). Lines inside boxes are medians.