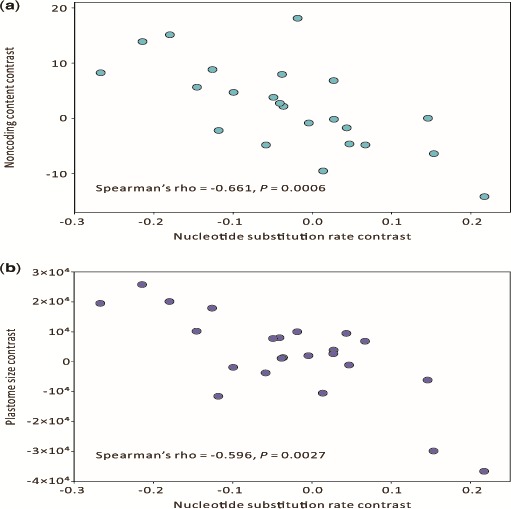
Fig. 3.—

Relationships between nucleotide substitution rate and noncoding content (a) as well as plastome size (b) among the 24 sampled cupressophytes. The examined traits were transformed into independent contrasts, then these contrasts were evaluated using Spearman's rank correlation test.
