
Figure 1. Schematic of the treatment groups summarising exposure periods and cross‐foster design.
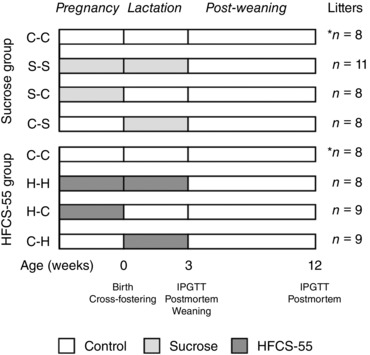
The C‐C offspring were born to a control dam and cross‐fostered to a different control dam (week 0), and these offspring were the controls for all subsequent analyses. The C‐C group was repeated in both sucrose and HFCS‐55 analyses, denoted by the asterisk (*). In the sucrose exposure group, S‐S offspring were born to a sucrose‐fed dam and cross‐fostered to a different sucrose‐fed dam; S‐C offspring were born to a sucrose‐fed dam and cross‐fostered to a control dam; and C‐S offspring were born to a control dam and cross‐fostered to a sucrose‐fed dam. In the HFCS‐55 exposure group, H‐H offspring were born to an HFCS‐55‐fed dam and cross‐fostered to a different HFCS‐55‐fed dam; H‐C offspring were born to an HFCS‐55‐fed dam and cross‐fostered to a control dam; and C‐H offspring were born to a control dam and cross‐fostered to an HFCS‐55‐fed dam. At 3 weeks, an intraperitoneal glucose tolerance test (IPGTT) was performed on one male and one female offspring per litter, with a post‐mortem conducted 1 day later. Offspring were weaned and fed a control diet until 12 weeks, when another IPGTT and post‐mortem was conducted.