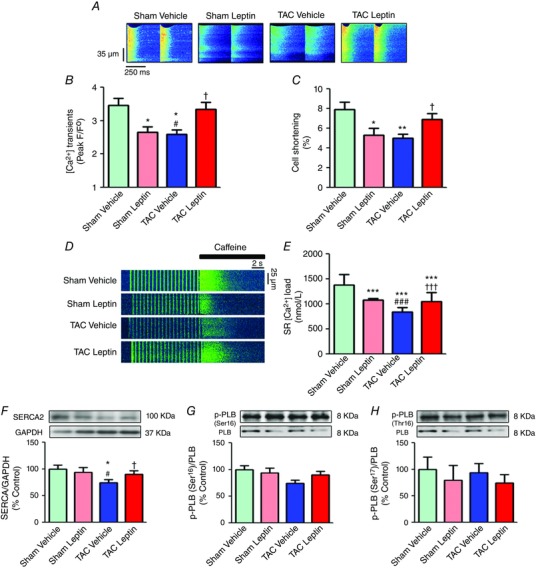
Figure 2. Leptin treatment depresses cellular [Ca2+]i transients and contraction in sham but restores it in TAC cardiomyocytes.

A, representative line‐scan confocal images of [Ca2+]i transients obtained in Fluo‐3 loaded cardiomyocytes from sham and TAC mice treated either with vehicle or with leptin. B, average [Ca2+]i transient amplitude measured as peak F/F 0, where F is the fluorescence trace and F 0 is the fluorescence in the diastolic period in each experimental group. C, cellular shortening expressed in percentage of cell length in each experimental group. D, representative line‐scan images of cardiac myocytes from each experimental group during field stimulation at 2 Hz and rapid 10 mmol L−1 caffeine application. E, average SR content. F, representative immunoblots (top) and average ratio of protein levels (bottom) expressed as a percentage of SERCA normalized by GAPDH. G, representative immunoblots (top) and average ratio of protein levels (bottom) expressed as a percentage of p‐PLB (Ser16) of the total PLB and (H) p‐PLB (Thr17) normalized by the total PLB. Data are the mean ± SEM [n = 4–6 mice; n = 50–70 cells in (B) and (C) and n = 20–40 cells in (D)]. * P < 0.05, ** P < 0.01 and *** P < 0.001 vs. sham vehicle; † P < 0.05 and ††† P < 0.001 vs. TAC vehicle; # P < 0.05 and ### P < 0.001 vs. sham leptin.
