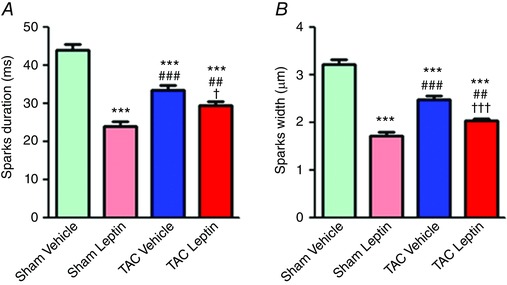
Figure 7. Ca2+ spark duration and width.

Average Ca2+ spark duration (A) and width (B) in each studied group (N = 4–6 mice; n = 50–70 cells). Data are presented as the mean ± SEM. *** P < 0.001 vs. sham vehicle; † P < 0.05 and ††† P < 0.001 vs. TAC vehicle; ## P < 0.01 and ### P < 0.001 vs. sham leptin.
