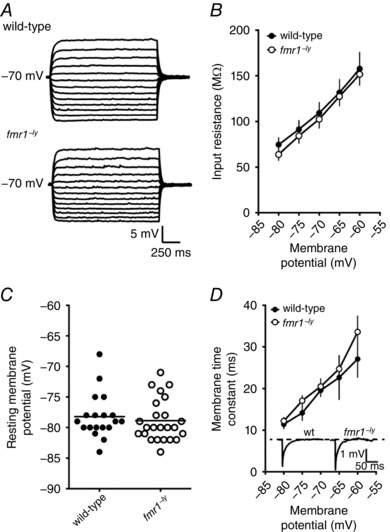
Figure 2. Subthreshold properties are not different between wild‐type and fmr1−/y L2/3 neurons.

A, representative traces showing the voltage response to a family of current injections used to estimate input resistance. B, summary graph showing that there is no significant difference in input resistance, across a range of voltages, between wild‐type and fmr1−/y neurons (wild‐type: 14 cells/6 mice; fmr1−/y: 20 cells/9 mice). C, there is no significant difference in resting membrane potential between wild‐type and fmr1−/y L2/3 neurons. D, summary graph showing that there is no significant difference in membrane time constant, across a range of voltages, between wild‐type and fmr1−/y neurons (wild‐type: 9 cells/4 mice; fmr1−/y: 12 cells/5 mice). Inset, representative traces showing the voltage response to a small hyperpolarizing injection used to estimate the membrane time constant.
