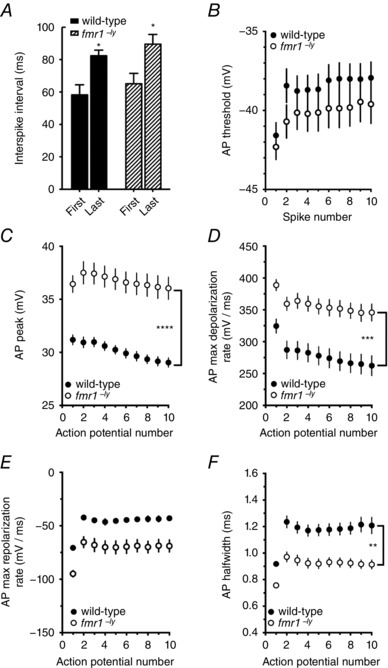
Figure 5. The differences between action potentials in wild‐type and fmr1−/y neurons persist during repetitive firing.

A, summary graph showing the interspike interval (ISI) between the 1st and 2nd action potential (first interval) and 9th and 10th action potential (last interval) in a train of 10 action potentials from wild‐type and fmr1−/y neurons. Note in both wild‐type and fmr1−/y neurons there was a significant increase in ISI between the first and last interval. B, summary graph showing that there was no significant difference in threshold during a train of 10 action potentials from wild‐type and fmr1−/y neurons (wild‐type: 14 cells/7 mice; fmr1−/y: 10 cells/6 mice). C, summary graph showing that action potential peak voltage remained significantly higher throughout the train in fmr1−/y neurons compared to wild‐type neurons. D, summary graph showing that the maximum rate of depolarization during each action potential was significantly faster throughout the train in fmr1−/y neurons compared to wild‐type neurons. E, summary graph showing that the maximum rate of repolarization during each action potential was significantly faster throughout the train in fmr1−/y neurons compared to wild‐type neurons. F, summary graph showing that action potentials remain significantly narrower throughout the train in fmr1−/y neurons compared to wild‐type neurons.
