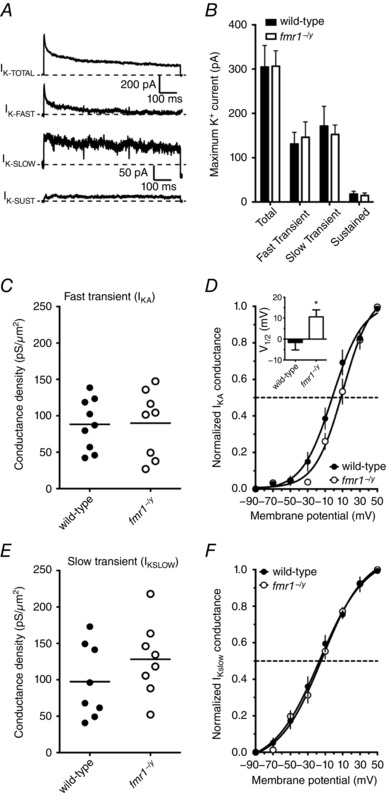
Figure 8. The activation of somatic I KA, but not I K‐SLOW, was depolarized in fmr1−/y neurons compared to wild‐type.

A, representative traces illustrating each of the types of K+ currents recorded from somatic outside‐out patches elicited using the indicated protocol. B, summary graph showing that there was no significant difference in the maximum amplitude of each of the K+ currents measured between wild‐type and fmr1−/y neurons (wild‐type: 9 patches/4 mice; fmr1−/y: 8 patches/3 mice). C, summary graph showing the maximum conductance density for the rapidly inactivating K+ current is not different between fmr1−/y neurons and wild‐type. D, summary graph showing that the voltage dependence of activation of I KA was significantly depolarized in fmr1−/y patches compared to wild‐type patches. E, summary graph showing the maximum conductance density for the slowly inactivating K+ current is not different between fmr1−/y neurons and wild‐type. F, summary graph showing that there is no significant difference in the voltage dependence of activation of I K‐SLOW between wild‐type and fmr1−/y patches.
