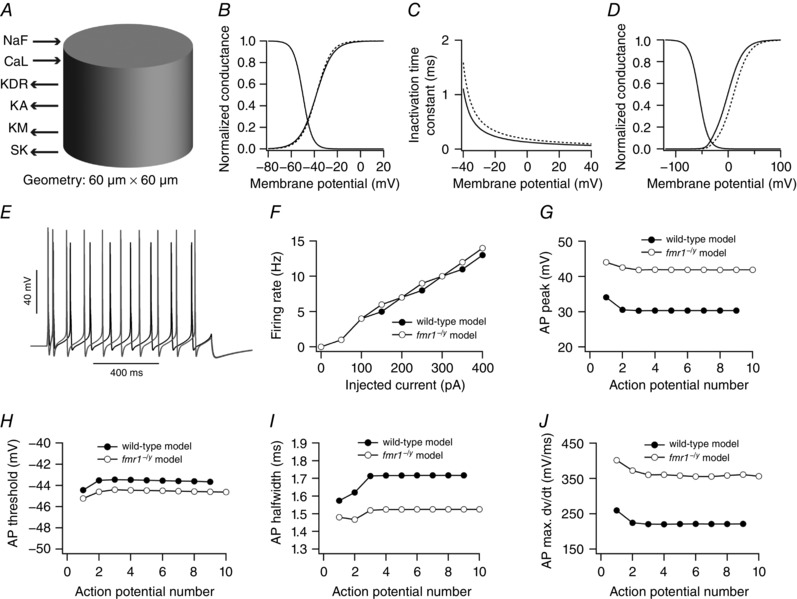
Figure 9. Simulations reveal that differences in fast Na+ and A‐type K+ channels between wild‐type and fmr1−/y neurons bring about differences in firing rate and action potential properties.

A, single compartmental model, expressing six ion channels, used in this study. B–D, differences in properties of fast Na+ and A‐type K+ channels to define wild‐type and fmr1−/y model neuron: activation curve (B) and inactivation time constant of fast Na+ channels (C), and activation curve of A‐type K+ channels (D). Continuous and dashed lines denote wild‐type and fmr1−/y model neuron, respectively. E, example voltage traces for 300 pA current injection from wild‐type (black) and fmr1−/y (grey) model neuron. F, firing rate profiles of wild‐type and fmr1−/y model neuron. G–J, peak voltage (G), threshold (H), half‐width (I) and maximum dV/dt (J) of action potentials in a spike train obtained from wild‐type and fmr1−/y model neuron.
