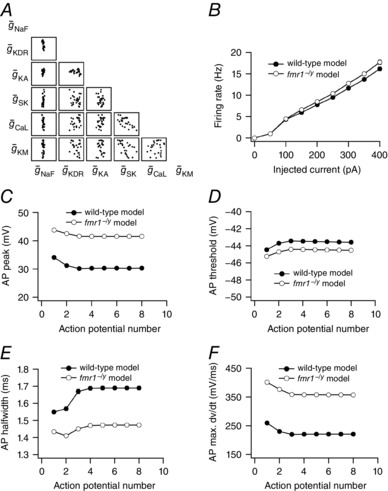
Figure 10. Differences in firing rate and action potential properties of wild‐type and fmr1−/y model neurons are independent of the choice of the conductance values in wild‐type neuronal models.

A, scatter plot matrix depicting variability in conductance values across 25 wild‐type neuronal models. B, population averaged firing rate profiles obtained from wild‐type and fmr1−/y model population. C–F, population averaged peak voltage (C), threshold (D), half‐width (E) and maximum dV/dt (F) of action potentials in a spike train obtained from wild‐type and fmr1−/y model population. For B–F, data is presented as mean ± SEM (n = 25).
