
Figure 2. Time course of fibre force and stiffness at tetanus plateau during the initial part of fatigue.
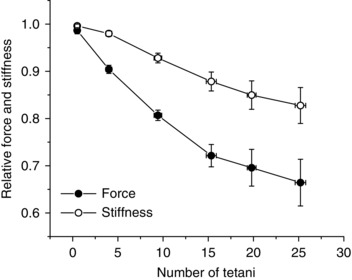
Force and stiffness data are expressed relative to plateau control values. Open circles, stiffness; filled circles, force. Mean values ± SEM (n = 13). Note that plotted fibre stiffness includes stiffness of crossbridge, myofilaments and tendons.