
Figure 3. Stiffness and force measurements during the tetanus rise.
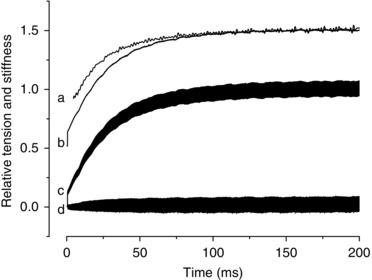
Sinusoidal length oscillations were applied throughout the tetanus rise to measure stiffness. Trace a, stiffness; b, force; c, force with oscillations superimposed; d, difference between c and b. Force and stiffness traces are shifted upward for clarity. The initial step rise of force visible on the tension trace is due to the short period of slow sampling at 1 ms/point preceding the fast sampling at 10 μs point−1.