
Figure 1. Whole‐cell currents recorded from isolated horizontal cells of rat and mouse retina.
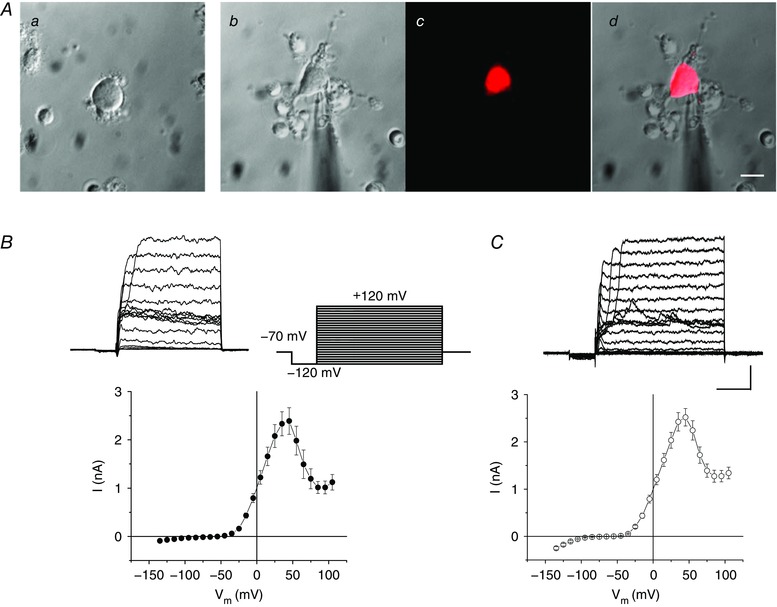
A, micrographs showing isolated horizontal cells from rat (a) and the Cx57‐tdTomato transgenic mouse obtained in differential interference contrast (b), fluorescence (c) and in a merged image (d). Scale bar: 10 μm. B, whole‐cell current elicited by a set of depolarizing voltage steps (inset to right) and I–V relationship (lower) in rats; n = 22 cells. C, similar current and I–V curve recorded in Cx57‐tdTomato mice; n = 24 cells. Scale bar: 1 nA, 20 ms. In Figs 2, 3, 4 and 7 following below, the voltage‐clamp protocol for whole‐cell recording is the same as shown here. [Color figure can be viewed at wileyonlinelibrary.com]