
Figure 3. Pharmacology of outward currents in Cx57‐tdTomato mouse horizontal cells reflects properties of a large conductance Ca2+‐activated K+ current.
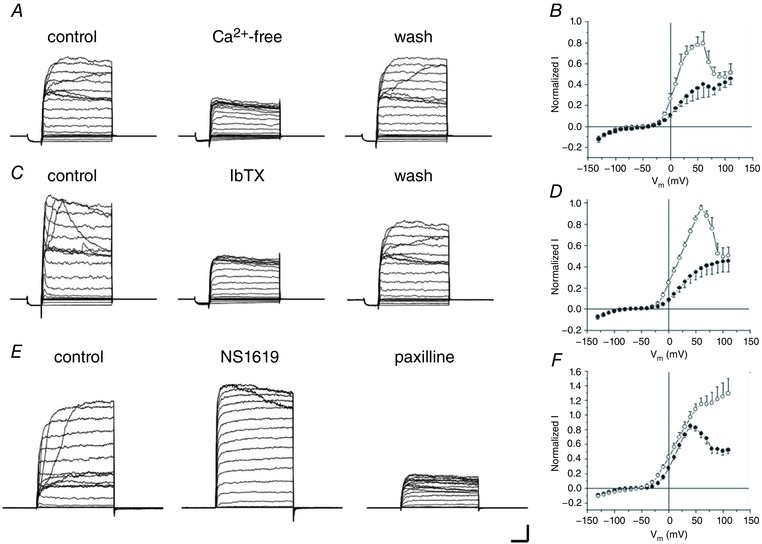
A, sample currents recorded before (control), during surperfusion of Ca2+‐free bath solution (Ca2+‐free) and after washing (wash) with normal bath solution. B, summarized results of I–V relationship of control (open circles) and Ca2+‐free (filled circles; n = 6). Currents were normalized to the peak control current for each neuron. C, current recordings before (control) and during 100 nm iberiotoxin (IbTX) superfusion and after washing (wash). D, summarized normalized I–V relation curves of control (open circles) and IbTX (filled circles; n = 7). E, example currents before (control), during 30 μm NS1619 superfusion, and following addition of 2.5 μm paxilline. F, summarized I–V curves of control (filled circles) and NS1619 (open circles; n = 14). Scale bar: 1 nA, 20 ms. Stimulus protocols as per Fig. 1.