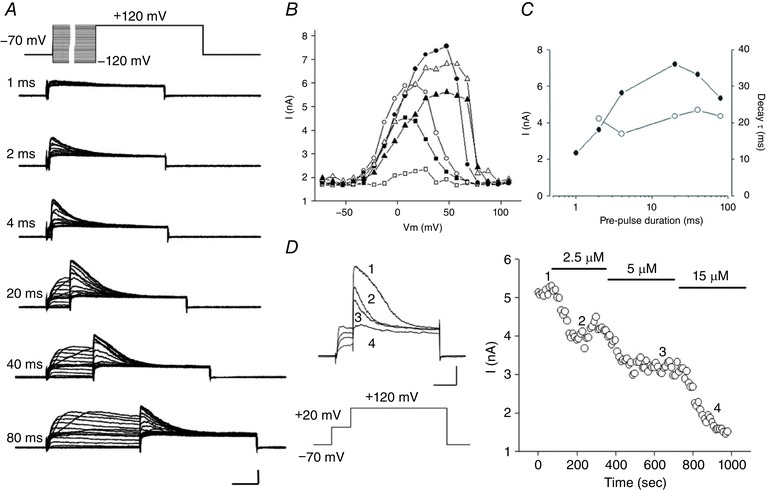
Figure 6. Ca2+‐ and voltage‐dependent activation and inactivation of BKCa current in a rat horizontal cell.

Properties of the activation/inactivation of BKCa current are revealed by varying the length of depolarizing steps to different voltages. A, representative current traces from a rat horizontal cell were obtained during a test step to +120 mV preceded by variable duration pre‐steps of incrementing voltage (top). Depolarizing pre‐step durations are labelled at the left of each set of traces. Scale bar: 2 nA, 20 ms. B, peak currents induced by test steps are plotted against the voltage of the pre‐steps having durations of 1 ms (open squares), 2 ms (filled squares), 4 ms (open circles), 20 ms (filled circles), 40 ms (open triangles) and 80 ms (filled triangles). C, peak currents (filled diamonds) and current decay time constants (open diamonds) plotted as a function of pre‐step duration on a logarithmic scale. D, Cd2+ blocks the BKCa component of outward current in a dose‐dependent manner. Left, example current traces elicited by repeating depolarizing pulse protocol (shown below currents) before (trace 1) and after superfusion of Cd2+ at concentrations of 2.5 μm (trace 2), 5 μm (trace 3) and 15 μm (trace 4). Scale bar: 1 nA, 20 ms. Right, peak current produced at +120 mV during superfusion of Cd2+. The numbers indicate the time points at which example traces shown at left were chosen.
