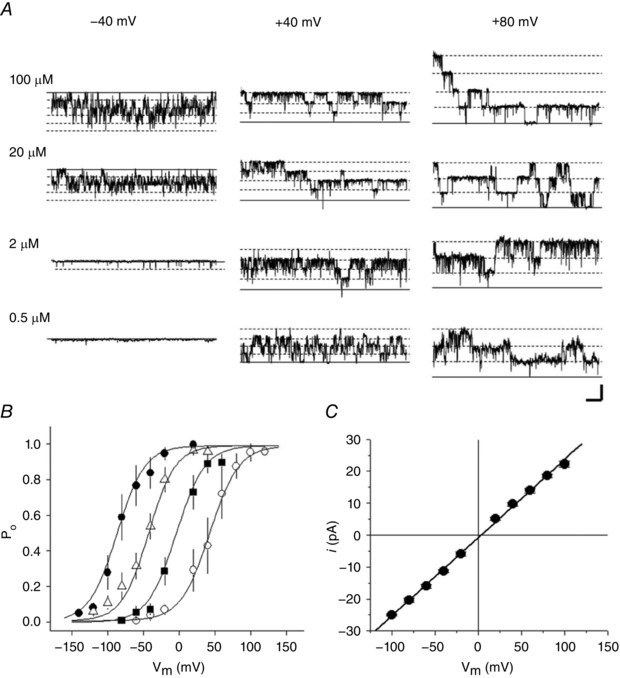
Figure 8. Ca2+‐ and voltage‐dependent activation of single BKCa channels.

Single channel currents were recorded from an inside‐out patch excised in symmetrical 150 mm K+ solutions from a horizontal cell from a Cx57‐tdTomato mouse retina. A, sample current traces at three holding potentials (columns labelled −40, +40 and +80 mV) and four nominal [Ca2+]i values (rows labelled 100, 20, 2 and 0.5 μm). Continuous and dashed lines indicate channel closed or open states, respectively. B, open probability (P o) of BKCa channels is plotted against holding potentials in [Ca2+] of 0.5 μm (open circles), 2 μm (squares), 20 μm (triangles) and 100 μm (filled circles). The smooth lines were generated by fitting the data points (symbols) with the Boltzmann equation (see text). Scale bar: 20 pA, 100 ms. C, single channel I–V curve fitted with line having slope conductance of 234 pS.
