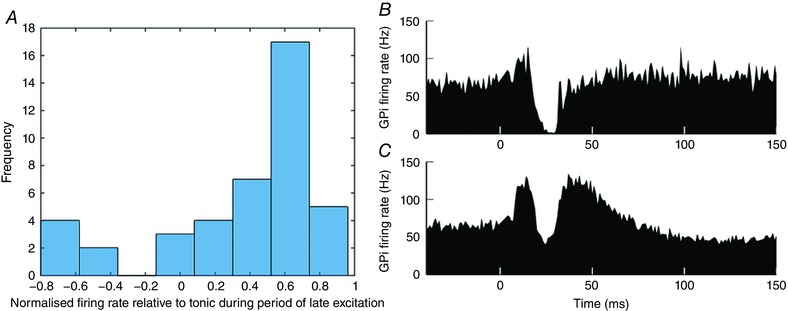
Figure 1. Clustering of experimentally recorded GPi single unit activity.

A, bar chart of mean normalised firing rate of each neuron over the time period 10–20 ms after the first inhibition (n = 42; zero corresponds here to tonic firing rate). B and C, means of PSTH data across the two identified clusters. B, mean of GPi neurons whose response to cortical impulse stimulation is biphasic (n = 6). C, mean of GPi neurons whose response to the same stimulus is triphasic (n = 36). Data from Tachibana et al. (2008). [Color figure can be viewed at wileyonlinelibrary.com]
