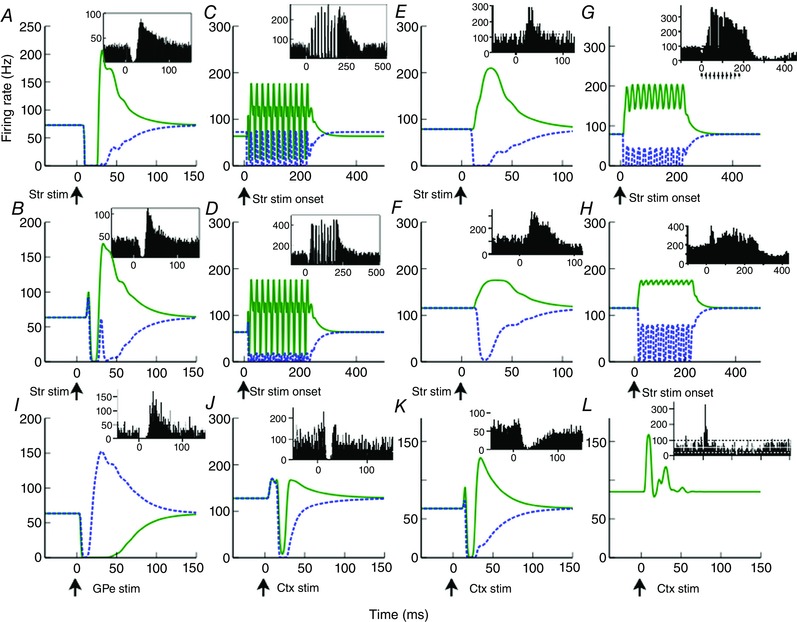
Figure 5. Model validation.

Performance of the model in 12 experimental manipulations on which the free parameters of the model were not fitted. Model primary channel/secondary channel responses are shown as blue dotted/green continuous lines, respectively. Experimental data [A–H: Kita et al. (2006), I–K: Tachibana et al. (2008), L: Sano et al. (2013)] are shown in insets. A (B), GPe (GPi) response to striatal impulse stimulation. C (D), GPe (GPi) response to striatal 50 Hz stimulation. E (F), GPe (GPi) response to striatal impulse stimulation following local application of muscimol. G (H), GPe (GPi) response to striatal 50 Hz stimulation following local application of muscimol. I, GPi response to impulse stimulation of GPe. J, GPi response to cortical M1 impulse stimulation following administration of muscimol into the GPe. K, GPi response to M1 cortical impulse stimulation following administration of muscimol into the STN. A–H insets are PSTHs averaged across all recorded neurons, and should thus be compared to the secondary channel model (green continuous lines) since we assume that the majority of neurons are in this channel. I–K insets are averages of GPi neurons whose cortical stimulation sites were chosen to yield largest responses. Thus, these figures should be compared to the model's primary channel output (blue dotted lines). L, D2 striatum to GPe connections lesioned. See Table 1 for model manipulations used to represent these experimental conditions.
