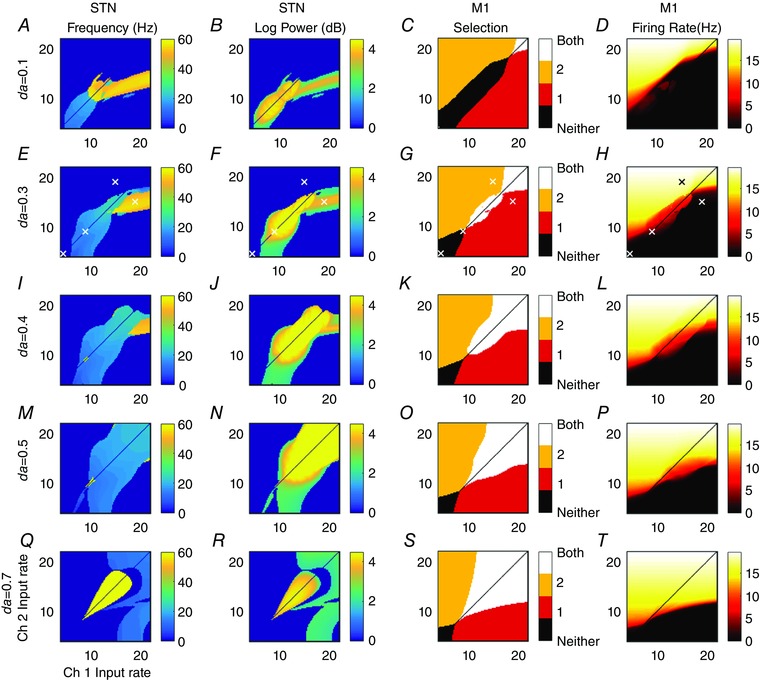
Figure 6. Oscillatory and selection properties of the model depend on cortical inputs and dopamine level.

Each panel shows a feature of channel 2's activity over the last 0.2 s of the 0.3 s simulation, and for a range of cortical input pairs with different firing rates. Column 1: Frequency of maximum power of channel 2 STN's weighted sum of inputs (simulated LFP). Column 2: the corresponding maximum log power of the frequency shown in column 1. Column 3: displays which of the action channels has a motor cortical firing rate above the 4 Hz cortical background level. Column 4: firing rate of channel 2 motor cortex. Channel 1 results for columns 1, 2 and 4 (not shown) are identical plots reflected in the line ch1 = ch2. A–D: da = 0.1. E–H: da = 0.3. I–L: da = 0.4. M–P: da = 0.5. Q–T: da = 0.7. Identical inputs (diagonals) not calculated to avoid unphysiological symmetries. White crosses in row da = 0.3 indicate parameter values used in Fig. 7 and selection analysis.
