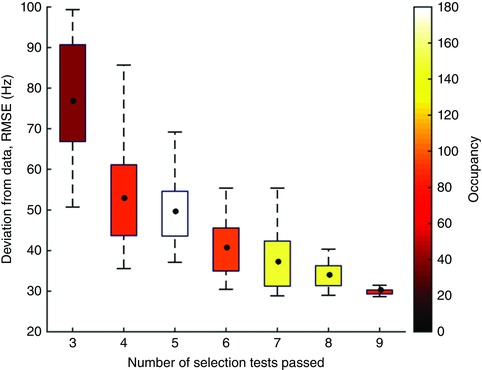
Figure 9. Correlation between selection ability (number of selection test passed) and deviation from experimental data (root mean squared error, RMSE).

The model was simulated using 750 randomly generated parameter sets derived from Gaussian kernels whose means are the MAP parameter values. Number of parameter sets within each box and whisker is shown on the colour bar. Black dots show the locations of means. Boxes show interquartile ranges, and whiskers show data outside 1.5 times the interquartile range. Correlation of means: R = −0.93, P = 0.003. There were no parameter sets that passed fewer than three tests. See text for a list of the nine selection tests.
