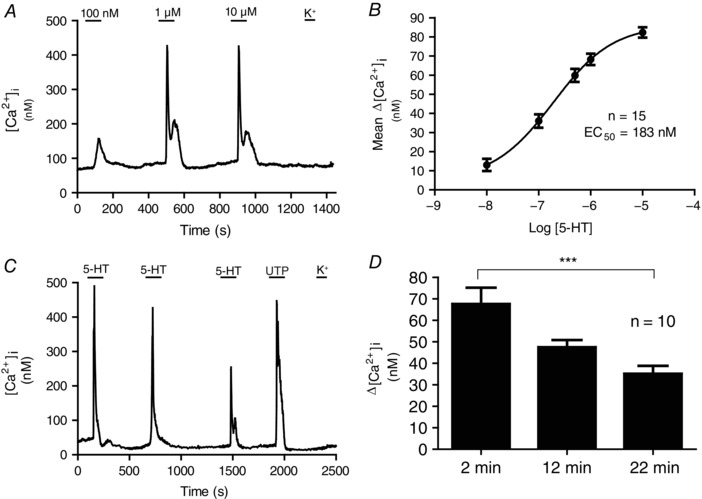
Figure 2. Dose–response curve and time‐dependent effects of 5‐HT on intracellular calcium responses in type II cells.

The effect of increasing doses of 5‐HT (100 nm, 1 μm and 10 μm) on intracellular Ca2+ concentration ([Ca2+]i) is shown in (A), for a type II cell. B, dose–response relation for mean 5‐HT‐induced Δ[Ca2+]i in type II cells; the dose–response curve was fitted with the Hill equation and yielded an EC50 = 183 nm (n = 15 dishes). C, repeated exposure to 10 μm 5‐HT caused a gradual decrease in [Ca2+]i responses in type II cells, presumably as a result of receptor desensitization. D, time‐course of the reduction in Δ[Ca2+]i responses in type II cells after 2, 12 and 22 min exposure to 10 μm 5‐HT; n = 10, *** P < 0.001, Friedman test with Dunn's multiple comparison post hoc test.
