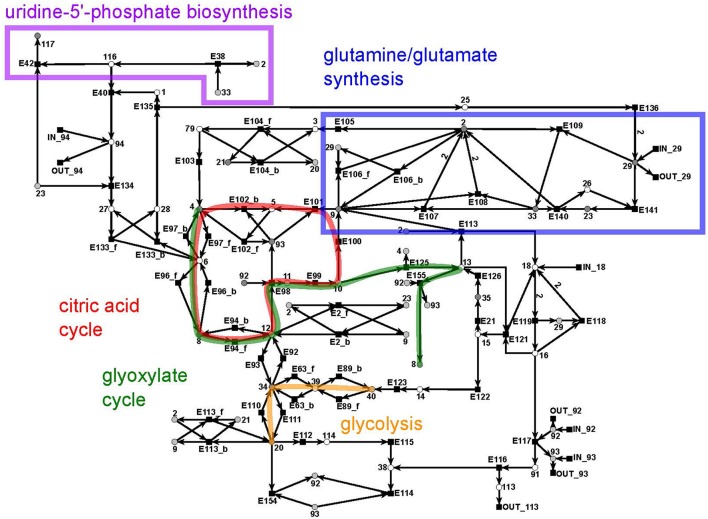
Figure 10.
The PN model of the citrate subnet adapted from Nöthen (2014). It covers the citric acid cycle (red), the glyoxylate cycle (green), part of the biosynthesis of uridine 5′-phosphate (purple box), the biosynthesis of glutamate and glutamine (blue box), and part of the glycolysis (yellow).

