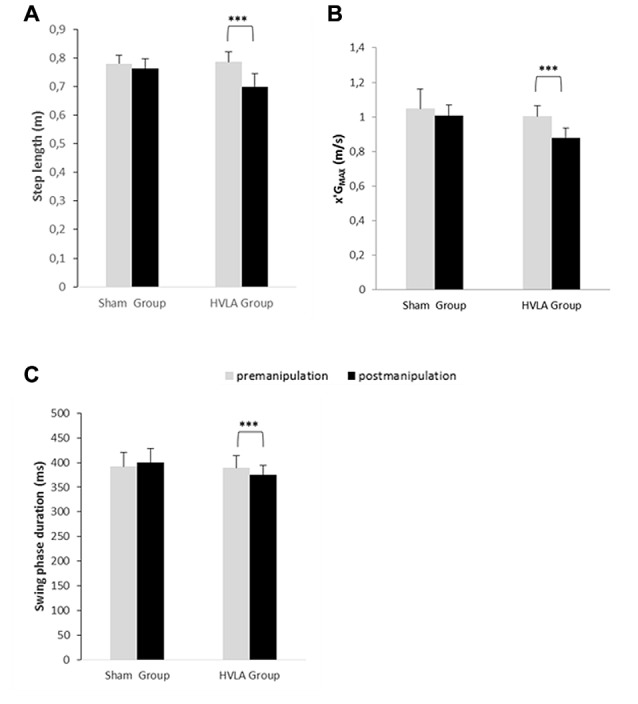
Figure 6.

Comparison of swing phase-related parameters of gait initiation between the pre- and post-manipulation conditions in the sham and HVLA groups. (A) Step length, (B) x′GMAX: peak center of gravity velocity and (C) swing phase duration. *** Statistical difference with p < 0.01, p < 0.001, respectively. Values given are means ± 1 standard error.
