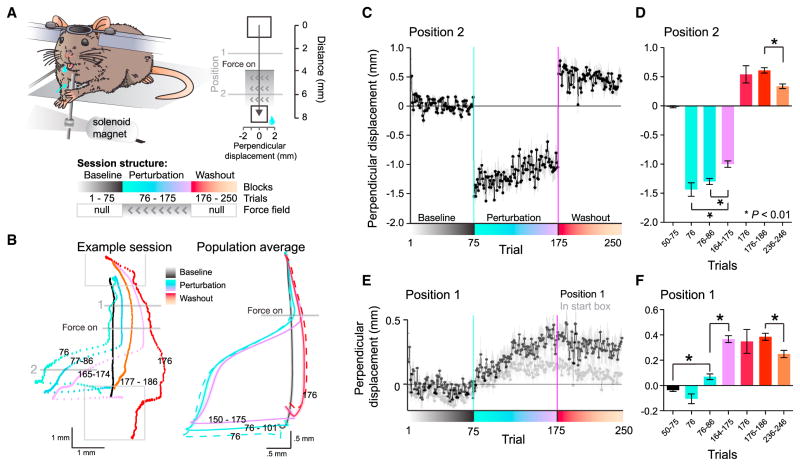
Figure 1. Force Field-Based Motor Adaptation Task for Mice.
(A) Diagram of the joystick platform with electromagnet, top-down view with physical dimensions indicating position 1 and 2, start and reward box, and the adaptation task structure: 75 baseline trials, 100 perturbation trials, and 75 “washout” (i.e., null field) trials.
(B) Left: an example session of one mouse showing the average baseline trajectory (black), the first perturbation trial (sea green), average of first ten (green), and the last ten perturbation trials (purple), the first ten washout trials (orange) and the first washout trial (red). The numbers indicate trials. Right: average trajectories for all sessions (n = 27 sessions, from n = 7 mice) with temporally aligned averaging (see STAR Methods). Dashed sea green line is the average first perturbation, and the dashed red line is the average of the first five washout trials. Solid lines are average paw path ± SEM in the direction of the perpendicular deviation, with the same color scheme as the left panel; solid green is the first 25 trials during the perturbation epoch, solid purple is the last 25 trials of the perturbation epoch, and solid red line is the average of the first 25 washout trials.
(C) Average perpendicular displacement in position 2 displayed as mean ± SEM versus trials; n = 27 sessions, from n = 7 mice.
(D) Average perpendicular displacement within indicated trials. Adaptation was measured as a significant change from early to late perturbation trials, and as a significant after-effect during washout (compared to baseline, all washout bins are significant). RM ANOVA p < 0.0001. Post hoc Dunnett’s Multiple Comparison, *p < 0.01. Mean ± SEM.
(E) As in (C) for position 1 (before force onset), showing predictive steering. Light gray shows change in perpendicular displacement inside the start box.
(F) As in (D) for position 1; RM ANOVA p < 0.0001. Post hoc Dunnett’s Multiple Comparison, *p < 0.01. Mean ± SEM.

