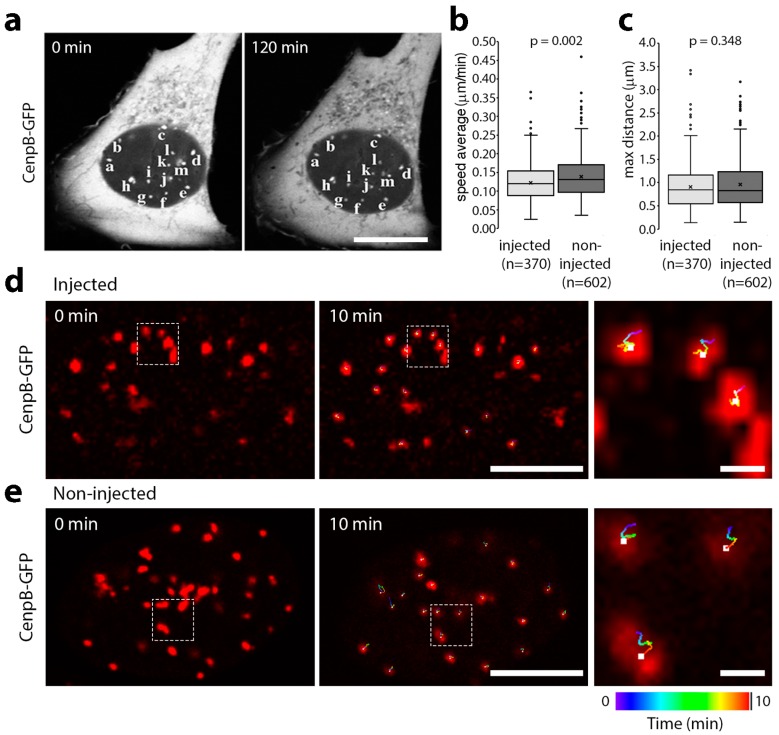
Figure 2.
Microinjection of lamin A/C chromatin binding site antibodies does not increase the mobility of centromeres. (a) The affinity-purified antibodies were conjugated to an SV40 NLS peptide and microinjected into either the nuclei or cytoplasm of U2OS cell stably expressing CenpB-GFP. With images taken every 10 min the positions of centromeres were essentially unchanged after 2 h. (b) Movies covering a period of 10 min with images taken every 1 min were analysed using Imaris 8 tracking software. The data for mobility were plotted using a Tukey box-plot with the median represented by a line and the mean by an x. The p-value from a Kolmogorov–Smirnov test is given above. (c) The same movies were also analysed after tracking to determine the two most distal points in the area covered by the centre of the CenpB-GFP signal. The data for distance were plotted using a Tukey box-plot with the median represented by a line and the mean by an x. The p-value from a Kolmogorov–Smirnov test is given above. No significant differences were observed between histone-binding site antibody injected and non-injected cells. (d) Tracking of the movement of the CenpB-GFP centromere spots was followed for each frame in the 10-min movies. The position of centromeres at the start of the movie is shown in the first panel, while the middle panel shows the final position with the tracking for the centre of the GFP signal generated using Imaris 8 software. Centromeres were false coloured in red to make it easier to visualize the tracking, which is colour-coded for time from blue to green to yellow and then to red and terminating at the white dot at the end of the movies (see the colour bar at the bottom of the figure). In the far right panel, an enlargement from the middle image is shown. (e) The same is shown for a non-injected cell. Scale bars, 10 µm.

