Figure 7.
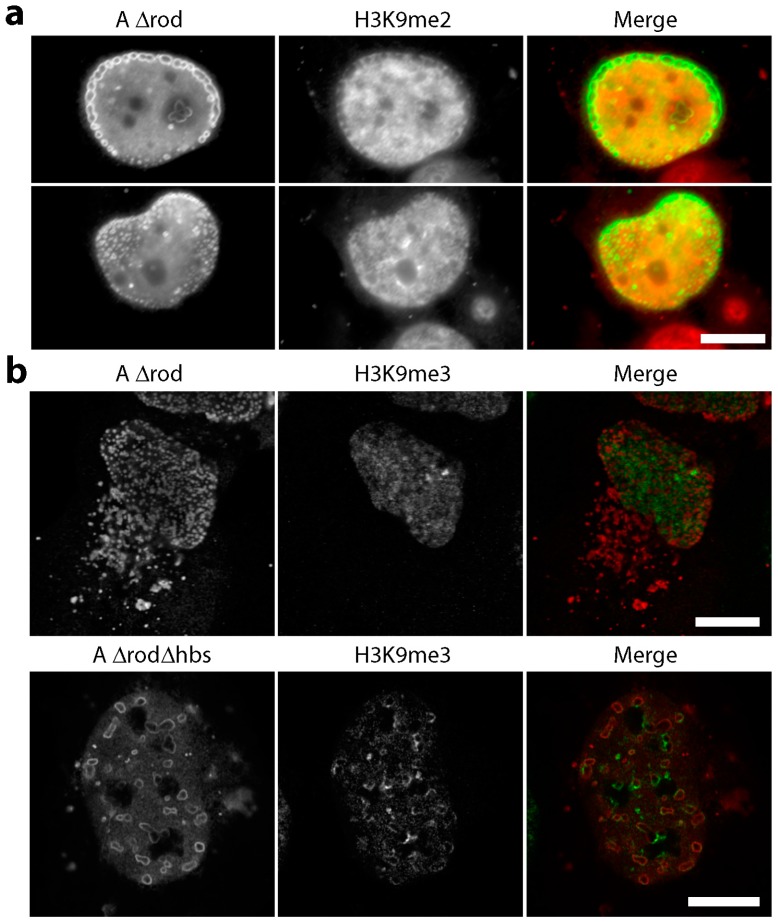
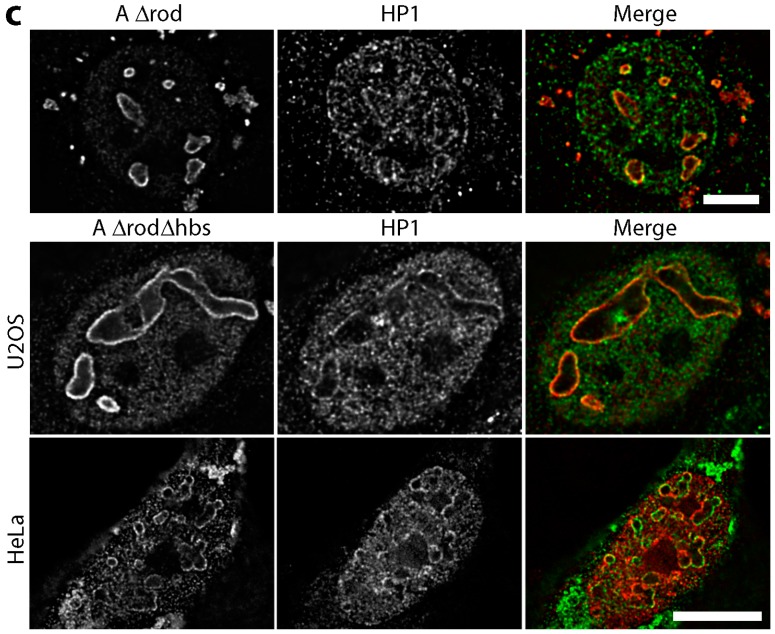
Heterochromatin effects of A∆rod and A∆rod∆hbs. (a) H3K9me2 staining in lamin A∆rod expressing U2OS cells. No notable accumulation of these marks was observed on the A∆rod structures. In fact, the greater concentrations of the epigenetic mark tended to occur in regions devoid of the A∆rod structures. (b) H3K9me3 staining in lamin A∆rod and A∆rod∆hbs expressing U2OS cells. Clear accumulations of histones carrying this mark were observed around the structures formed by the A∆ proteins. (c) HP1 staining revealed concentrations that co-localized with the A∆rod structures in U2OS cells. To test if this was specific to the mapped histone-binding site, cells expressing A∆rod∆hbs were also stained for HP1. The interaction appears to be from a distinct region in the mini-lamins because a similar co-localization was observed. This co-localization with the A∆rod∆hbs structures was observed in both U2OS (upper panels) and HeLa (lower panels) cells. Deconvolved images are shown in this panel to better clarify the co-localization. All scale bars, 10 µm.


