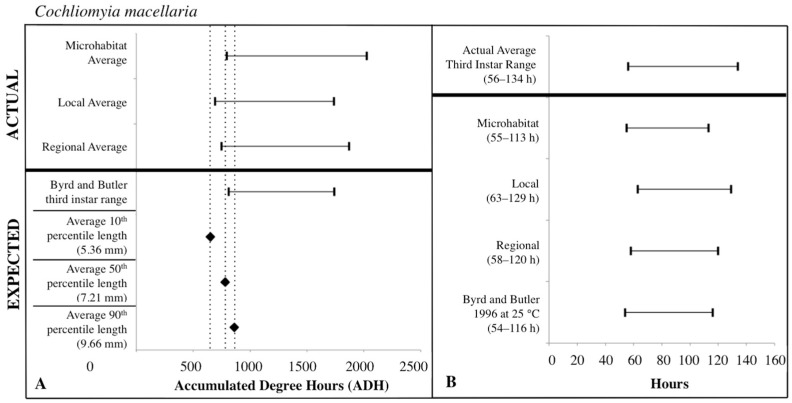
Figure 7.
Comparison of expected accumulated degree hours (ADH) associated with Cochliomyia macellaria third instar developmental stage and length to actual third instar ADH ranges calculated for each temperature source: microhabitat, local, and regional. Actual ADH ranges represent the average range among carcasses. Black diamonds represent expected ADH values derived from 10th, 50th, and 90th percentile third instar lengths (A). Comparison of the average Cochliomyia macellaria third instar post-colonization interval (PCI as hours) to estimated PCIs for each temperature source (B). For both A and B: thin horizontal lines with vertical ends represent minimum-maximum ranges and values above the thick black line are actual while those below are expected or estimated based on different temperature sources or development data set.

