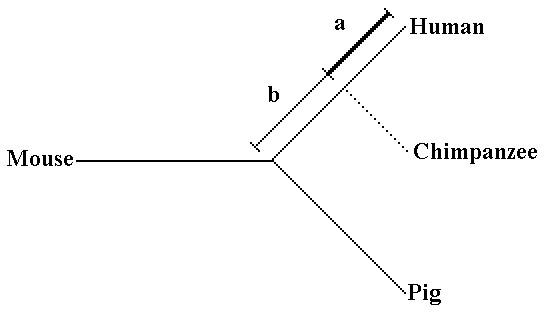
Figure 1.

Phylogenetic tree of key mammalian species. A schematic drawing showing the topologies considered in our study compared to a recent study on human, chimpanzee and mouse trios [23]. Branch a shows the branch considered in the study by Clark et al (2003) while branch a+b represents the evolutionary time scale studied here.
