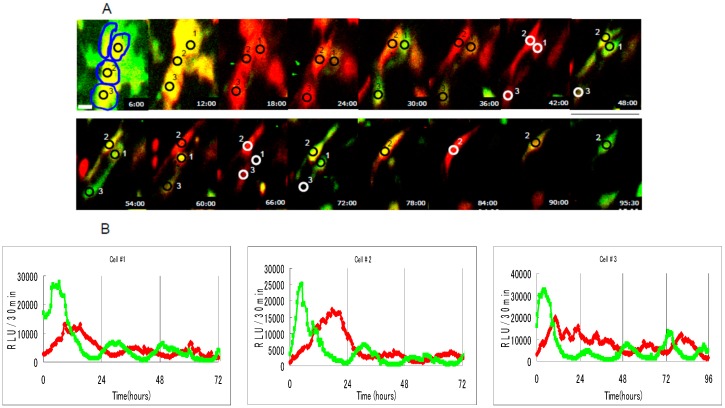
Figure 1.
Bioluminescence imaging of dual gene expression at the single-cell level. (A) The dual-color bioluminescence imaging of NIH3T3 cells cotransfected with the Bmal1-red luciferase plasmid (red) and the Per2-green luciferase plasmid (green), showing circadian rhythms of green and red luminescence, respectively. Each spot is on a separate cell. Scale bar, 20 μm; (B) Representative circadian bioluminescence rhythms from individual NIH3T3 cells cotransfected with Bmal1-pSLR plasmid (red) and Per2-pEluc plasmid (green) for 3–4 days. Each graph represents real-time analysis data of quantitative bioluminescence intensity for the respective spot shown in Figure 1A. Reproduced with permission from [25].

