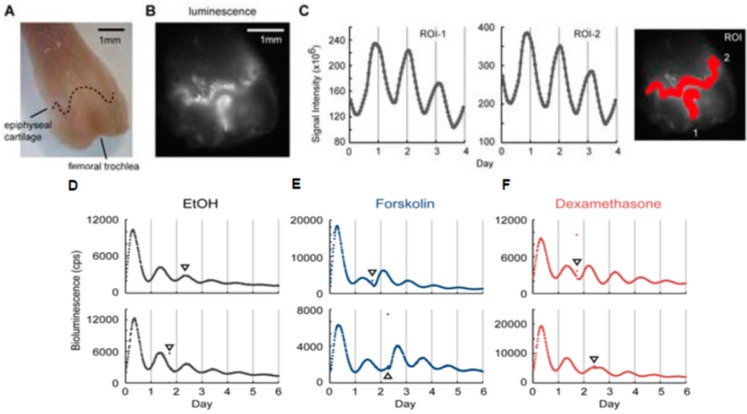
Figure 3.
Bioluminescence imaging of circadian rhythms in Per2-Luc mouse femur. (A) The overview of the distal half of the femur. The dotted line indicates epiphyseal cartilage. The mirror-reversed image was used for comparison to the bioluminescence image. A sample was obtained from a 16.5-week old mouse and cultured for 6 days before observation. (B) The bioluminescence image obtained by a microscope-based high sensitivity CCCD camera system. (C) A time series analysis of the epiphyseal cartilage (ROI-1) and femoral trochlea (ROI-2). The right panel shows set ROIs. (D–F) Effects of forskolin and dexamethasone (DEX) on circadian clocks. Representative data showing the phase advancement (upper panels) or phase delay of the bone circadian clock (lower panels). The arrowhead indicates chemical administration. From left to right, the vehicle (ethanol; EtOH) (D), DEX (E), or forskolin (F). Reproduced with permission from [30].

