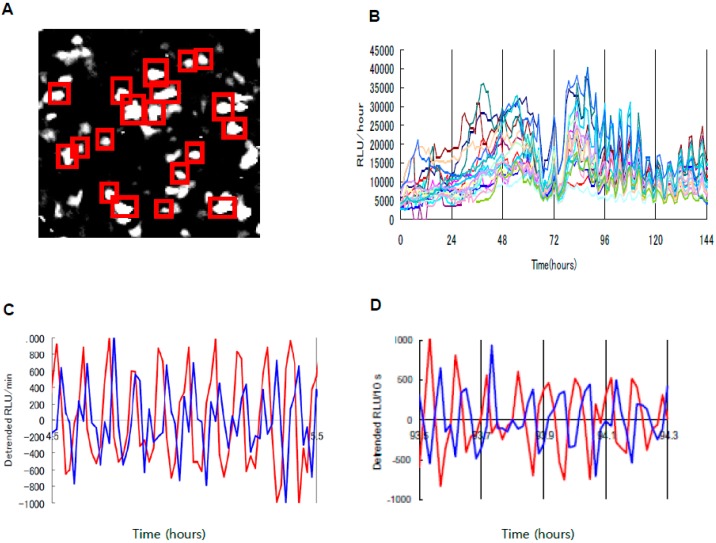
Figure 4.
Bioluminescence imaging of ATP, Ca2+ and oxygen during chondrogenesis. (A) Right panel: Bioluminescence imaging at the single-cell level shows that bioluminescent intensities of Actin-Phrixothrix hirtus red luciferase (PxRe) to report intracellular ATP levels in individual cells oscillate collectively by intercellular synchronization during chondrogenesis. Left panel: Time course data of PACTIN-PxRe intensities of individual cells indicated by red squares after chondrogenic induction. Reproduced with permission from [65]. (B) Simultaneous monitoring of intracellular oxygen (blue line) and ATP (red line) levels during chondrogenesis in the micromass culture of mesenchymal stem cells (MSCs) by using an oxygen reporter (PACTIN-Rluc) and ATP reporter (PACTIN-PxRe). Reproduced with permission from [65]. (C) Simultaneous monitoring of intracellular Ca2+ (blue line) and ATP (red line) levels during chondrogenesis in micromass culture of ATDC5 cells using a calcium reporter (aequorin) and ATP reporter (PACTIN-PxRe). Reproduced with permission from [67].

