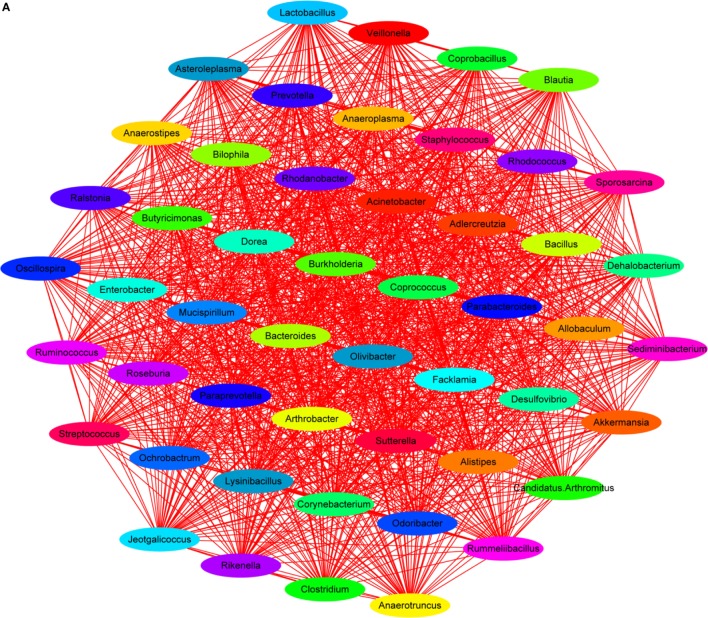
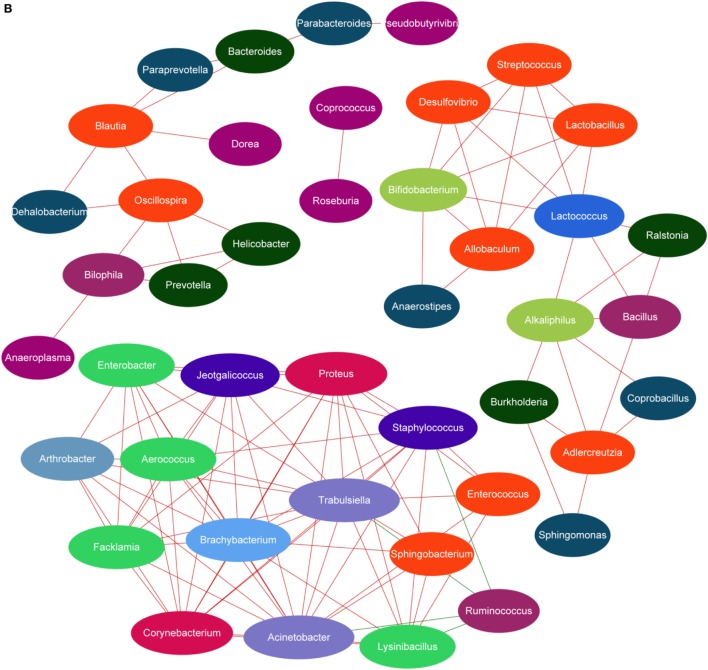
Figure 12.
Dominant species interaction-associated network analysis results. Nodes represent the dominant species under the identity of different colors: the red line shows a positive correlation and the green line shows a negative correlation. More connections by nodes indicated more association with others. (A) Antibiotics rapidly declined the diversity and destroyed the stability of the whole ecological system; (B) HEP3 can main the diversity and stability of the whole ecological system in IBD model mice.


