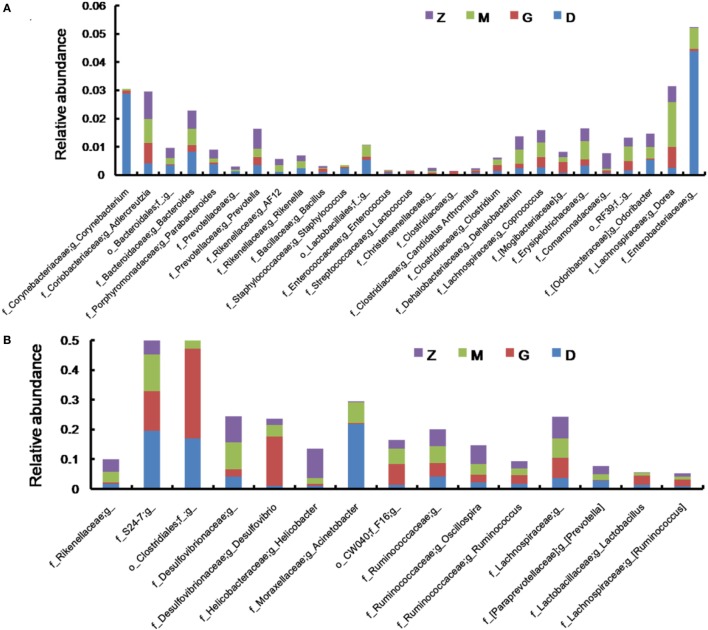
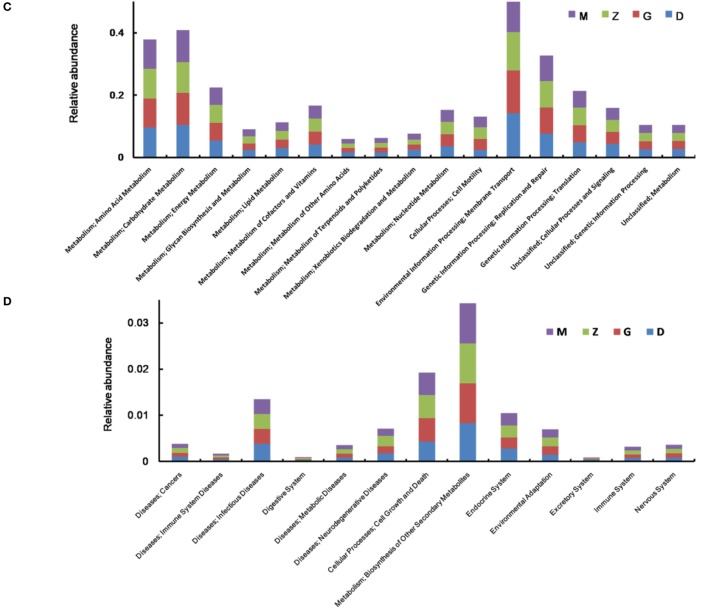
Figure 7.
Effect of HEP3 on the microbiota classification and abundance detected by 16S rRNA gene sequencing analysis of cecal contents from the mice with cyclophosphamide-induced immunotoxicity at the genus level (A,B). Effect of HEP3 on KEGG pathways of gut microbiota in mice with cyclophosphamide-induced immunotoxicity (C,D). Z denotes the control group just treated with vehicle, M is the cyclophosphamide-induced (intraperitoneal injection of 80 mg/kg) group, D is the 100 mg/kg HEP3-treated group, and G is the 200 mg/kg HEP3-treated group.


