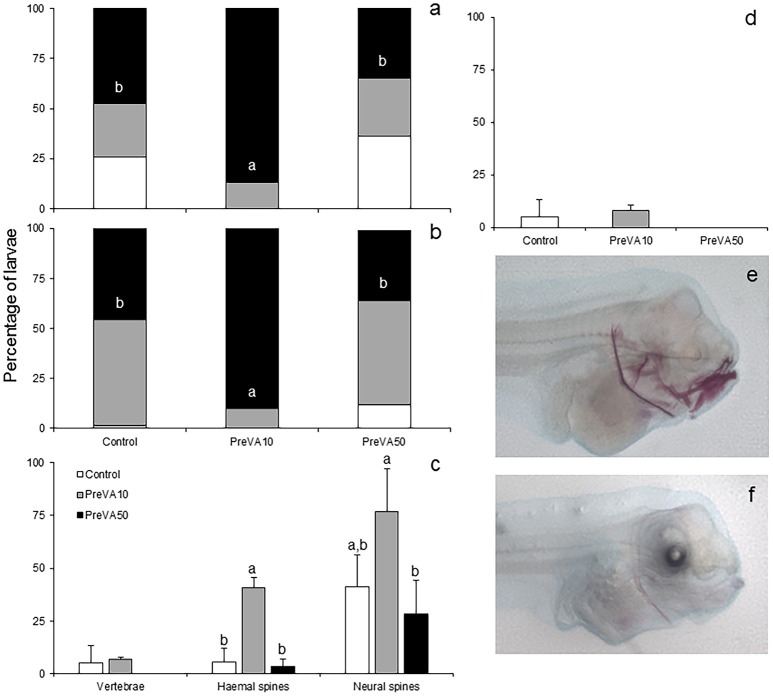
Figure 3.
Mineralization degree of different skeletal structures in 10 dph Senegalese sole larvae fed increased dietary vitamin A levels at different developmental stages. Percentage of larvae showing different degrees of mineralization showing fully mineralized (black bar fraction), slightly mineralized (gray bar fraction) and not mineralized (white bar fraction) structures of upper jaw (a) and lower jaw (b). Percentage of larvae showing an onset of mineralization in axial structures (vertebrae, haemal and neural spines) (c), and hypurals (d). Detailed view of the degree of mineralization of several cranial structures from PreVA10 (e) and Control (f) larvae at 10 dph. Note the extended alizarin red staining in several structures (upper and lower jaws, cleithrum, ethmoid and neural spines) in the PreVA10 larvae, whereas a slight mineralization of the cleithrum in the Control larvae. For a detailed description about the different experimental groups, please see the legend of Figure 1. Different letters within black bar fraction in graphs (a,b) or at the top of each bar on the rest of the graphs denote statistically significant differences among experimental groups (ANOVA, P < 0.05; N = 3).

