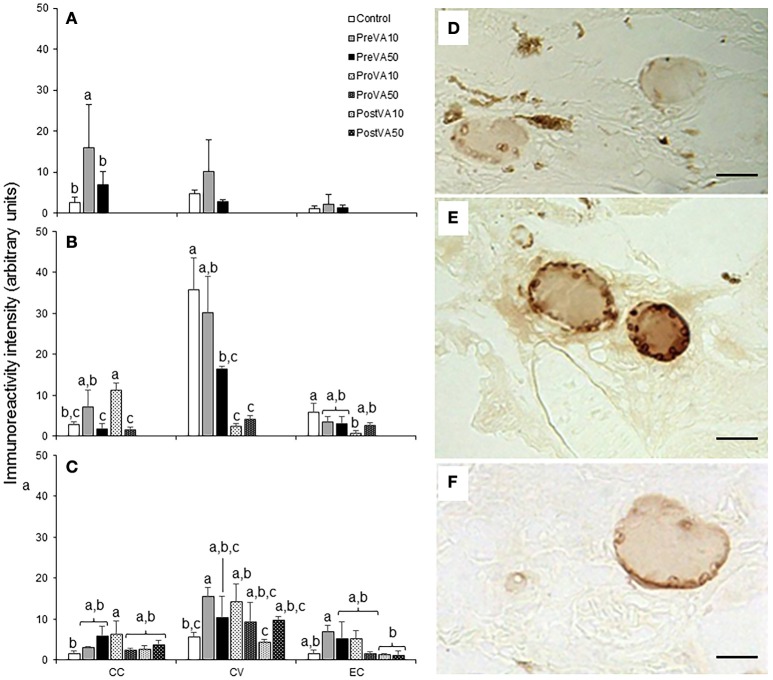
Figure 8.
Semi-quantitative assessment of triiodothyronine (T3) hormone (mean ± standard deviation) content by using immunohistochemical approaches in Senegalese sole fed with experimental diets. T3 content at 10 (A), 21 (B), and 55 (C) dph. A detailed view of the immunoreactive intensity in thyroid follicles in a Control (D), PreVA10 (E), and PreVA50 (F) larvae at 10 dph. CC, colloid content; CV, cortical vesicles content; EC, epithelial cells content. For a detailed description about the different experimental groups, please see the legend of Figure 1. Different letters at the top of each bar denotes statistically significant differences among experimental groups (ANOVA, P < 0.05; N = 3). Scale bar = 200 μm.

